Testing of the U model
Verify against MuPad "analysis" document: U_model_analysis.html 1/15/15
close all
clear all
Here you will find all figures
%figures_folder='U_testing_figures';
TEST COMPUTATION OF EQUILIBRIUM POPULATIONS
Set some meaningful parameters matching settings of MuPad analysis document
Rtotal=1e-3; % Receptor concentration, M
LRratio_array=[0 : 0.02 : 1.5]; % Array of L/R
K_A   = 1e5;

% Set appropriate options for the model (see model file for details)
model_numeric_solver='analytical'  ;

model_numeric_options='none';
Compute arrays for populations and plot
concentrations_array=[];
for counter=1:length(LRratio_array)
    % compute
    [concentrations species_names] = equilibrium_thermodynamic_equations.U_model(...
        Rtotal, LRratio_array(counter), K_A,...
        model_numeric_solver, model_numeric_options);
    % collect
    concentrations_array = [concentrations_array ; concentrations];
end
Plot
Figure_title= 'U model';
X_range=[0 max(LRratio_array)+0.1 ]; % extend X just a bit past last point
Y_range=[ ]; % keep automatic scaling for Y
% display figure
figure_handle=equilibrium_thermodynamic_equations.plot_populations(...
    LRratio_array, concentrations_array, species_names, Figure_title, X_range, Y_range);
% save it
%results_output.output_figure(figure_handle, figures_folder, 'Concentrations_plot');
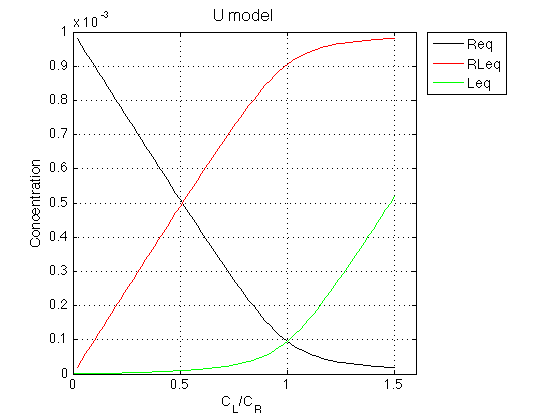
Observations The result matches the simulations done in the "analysis" document. The code is correct.