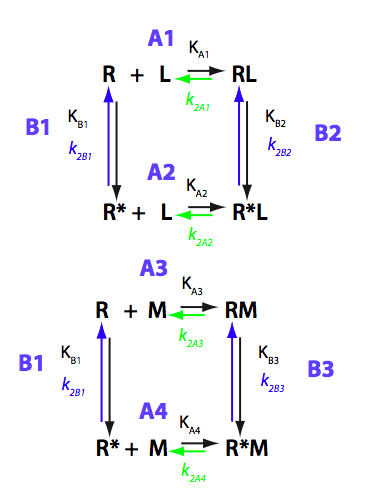
This is a competitive binding mechanism. The way we simulate this system with the two ligands is that we perform titration with L while the concentration of M is set to a constant. One may also think about this model as simulating behavior of the receptor that is partially saturated with a competitive contaminating ligand M (for example, incomplete purification after extraction from the cells).
You you need to simulate titration with M: simply exchange the labels between L and M and correspondingly change the constants in the model.
NOTE: Calculation of populations of species is relatively slow due to complexity of the equations, which are solved numerically. If you need to speed up the calculations - reduce number of points on smooth curves for populations graph (LRpoints in the general setup file setup_implementation_test.txt)
Isomerization does not occur, M does not bind to R. We set M concentration to 0.6 of total R concentration for this test.
Simulate setup_implementation_test U_R_RL_RM_test1
Report: summary_report
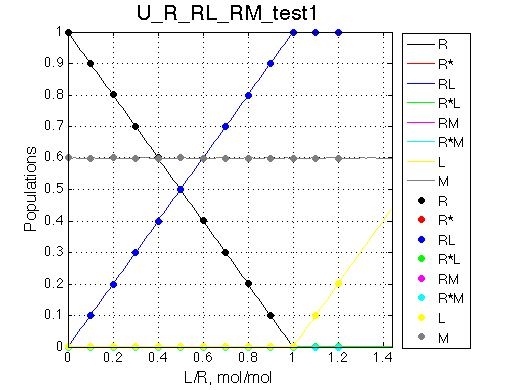
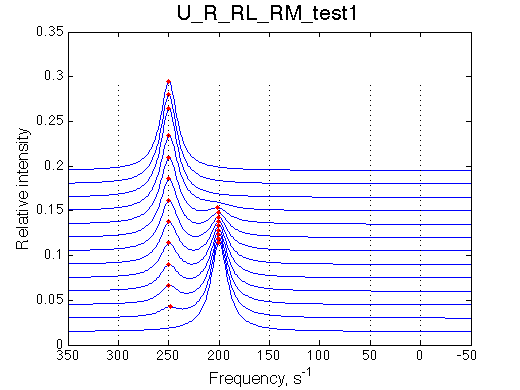
As expected, M does not bind and its population in the solution does not change.
Here we remove portion of the mechanism involving species containing M.
Simulate setup_implementation_test U_R_RL_RM_test2
Report: summary_report

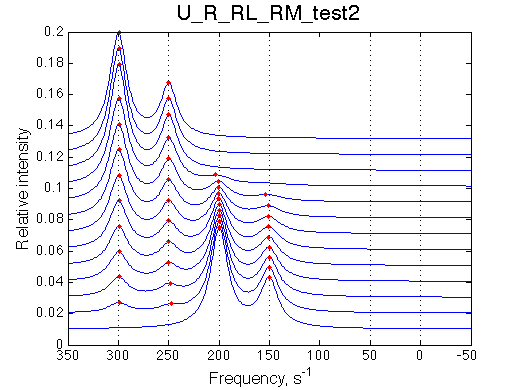
Model behaves as expected: addition of L shifts isomerization equilibrium in R. Concentration of M remains unchanged.
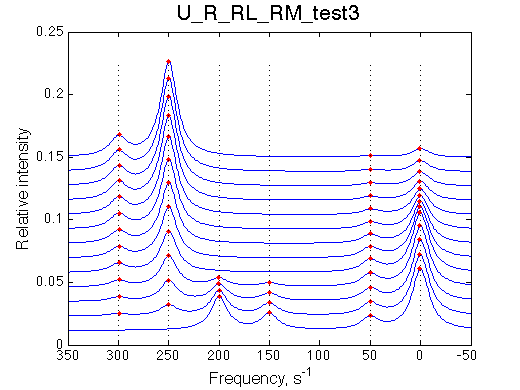
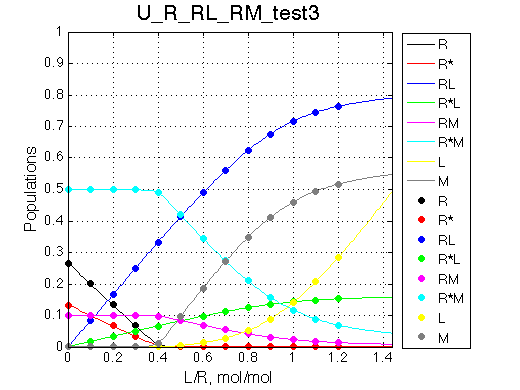
Simulate setup_implementation_test U_R_RL_RM_test3
Report: summary_report
 |
 |
Species chemical shifts (left to right on the graph): R*L RL R R* RM R*M
|
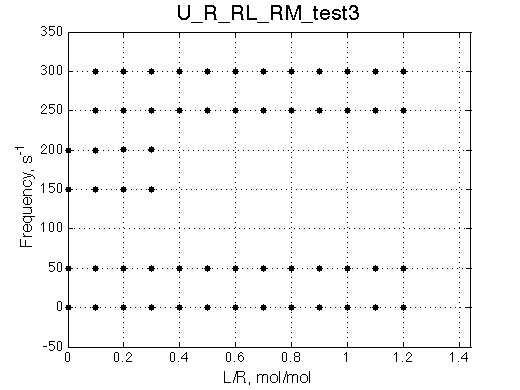 |
Looks right.
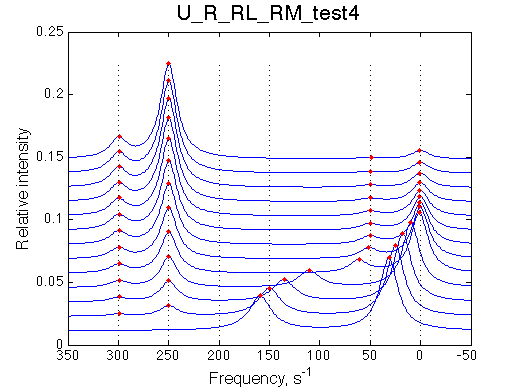
Here we are setting fast exchange regime between R and R* species, as well as between RM-R*M species.
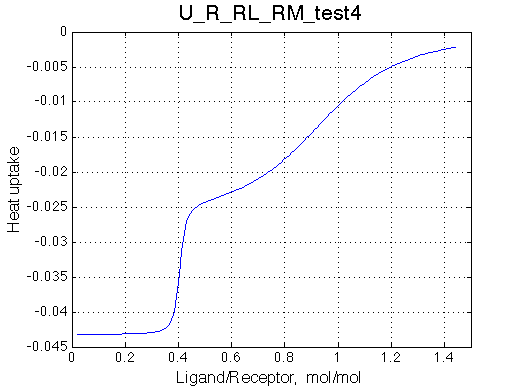
Simulate setup_implementation_test U_R_RL_RM_test4
Report: summary_report
 |
 |
Species chemical shifts (left to right on the graph): R*L RL R R* RM R*M
|
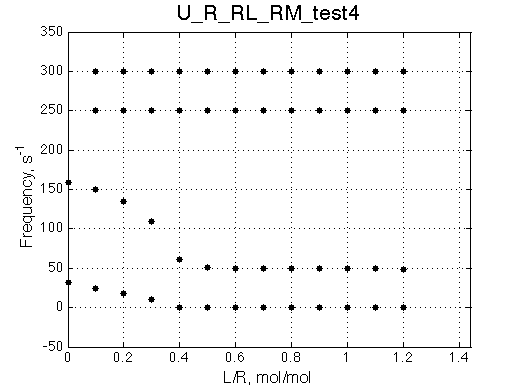 |
To understand what is happening with the line shapes let's discuss origin of the individual peaks.
In the absence of ligand L:
Once we added L we see appearance of the resonances for RL (250s-1) and R*L (300s-1) in slow exchange. As titration progresses the RL and R*L species accumulate maintaining the constant ratio set by KB2 =0.2.
With addition of L the fast exchange average resonances of R-RM and R*-R*M experience the following peculiar changes:
Complex models with multiple binding/isomerization equilbria are capable of producing very sophisticated looking spectral patterns. However, using the reasoning described above one may always rationalize complex spectral patterns.
The model works as expected.
Back to LineShapeKin Simulation Tutorial