
Goal of this section is
Here we will compare outcomes of the four alternative models for conditions when all transitions are very slow. I choose binding affinity of 108 M-1 and off-rate and isomerization constants of 1 s-1. R and RL are separated by 100 s-1 and R* or R*L - by 100 s-1 from corresponding species. Isomerization equilibrium is shifted 5:1 toward *-forms.
Location: As_Bs/
|
|
|
|
| U_As.txt | U_R_As_Bs.txt | U_L_As_Bs.txt | U_RL_As_Bs.txt |
Now we will imagine performing direct and reverse titrations and compare behaviors originating from different models.
When
If the mechanism is simple binding with no coupled isomerization we will observe the same type of spectral changes in both direct and reverse titrations because neither of the species has populations split between alternative conformers:
L -> R titration R -> L titration
(Here I simply duplicate image of U_As lineshapes in place of reverse titration series. Real titration data will have different chemical shift separations and line widths associated with R and L creating different spectral appearance with the same pattern of disappearing and newly appearing peaks).
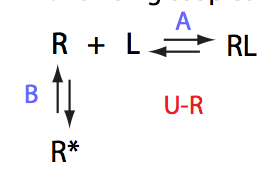
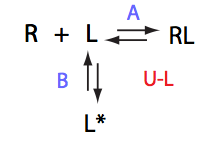
If the mechanism involves isomerization of one of the binding partners then direct and reverse titrations will give different complementary results represented by the U_R and U_L models:
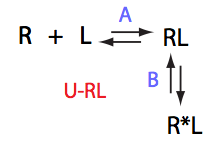
If isomerization occurs in the RL complex then the direct and reverse titration with produce similar type of spectra where a single peak of the original species disappears and the two peaks of the bound form are detected. Isomerization of the complex most likely will perturb signals of both binding partners in the complex so both reverse and direct titration spectra will show this pattern.
L -> R titration R -> L titration
Back to Analysis of Direct and Reverse Titrations