Location: tutorial_simulations/Spectral_patterns/2/
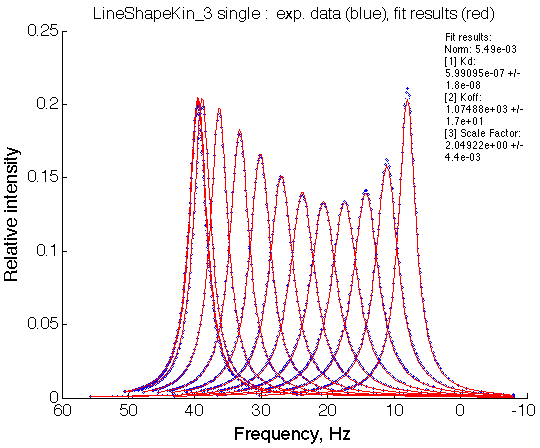
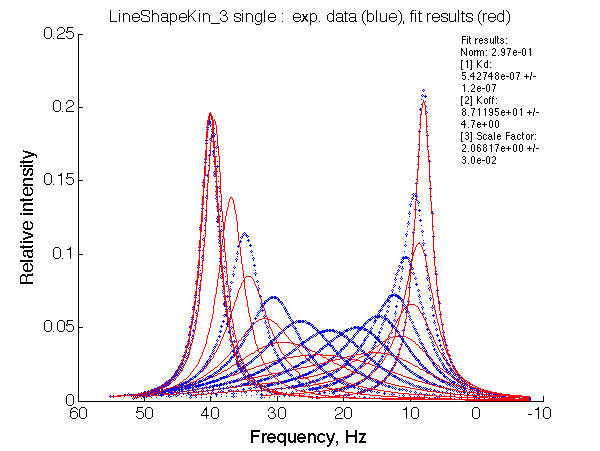
Here we will analyze all the models/conditions that give rise to a fast-exchange shifting resonance like the one depicted below.
We will identify the distinct features of the line shapes originating from different models, which may helpful in establishing the 'dynamic identity' of the system. We will analyze peak positions, line widths and we will use fitting with the 2-site exchange model as a diagnostic tool.
Below I will do simulations for all the models and perform a side-by-side comparison at the end.

The simple 2-site exchange without any coupled processes is the number one candidate to account for the fast exchange line shape. Let's simulate the line shape and fit it with the two-site exchange model. We expect to have a very good fit!
We make sure in the simulation to choose the spectral window wide enough so the tails of the peaks are included - to enable subsequent integration and fitting.
Results: U_Awf/
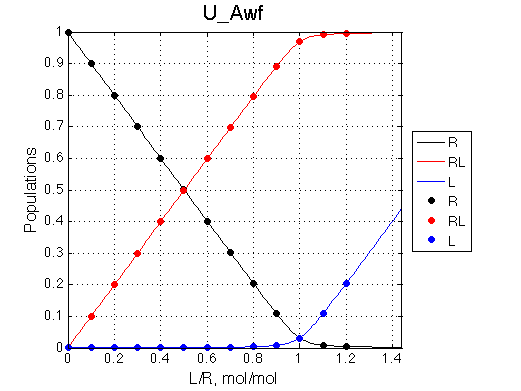
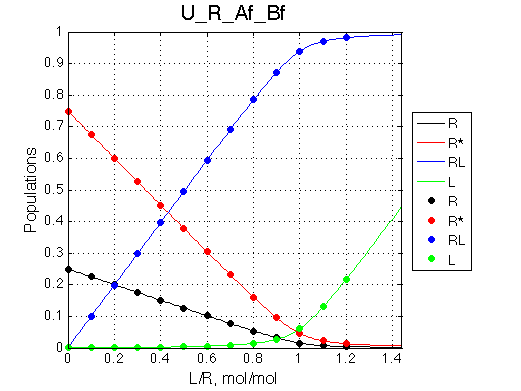
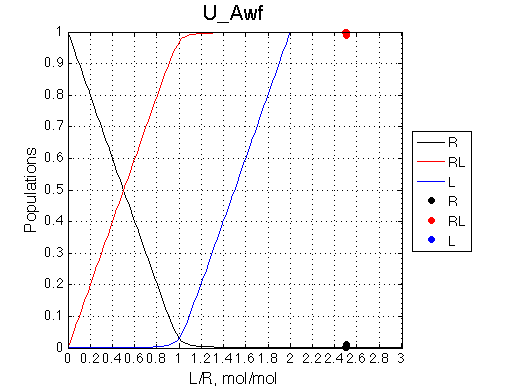
Calculated populations of species
|
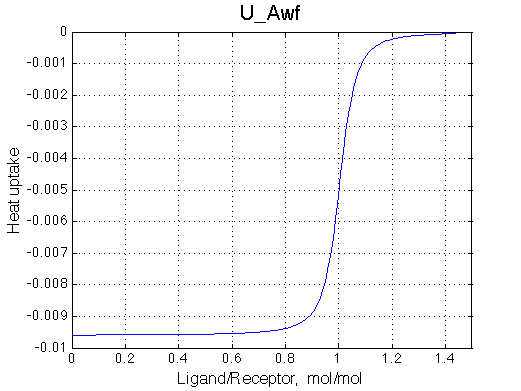
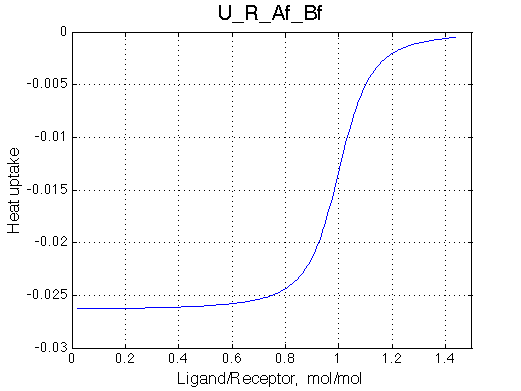
ITC profile
|
|
| ITC curve is symmetrical around 1 (as expected if overall dilution of the receptor is minimal through the titration range). | ||
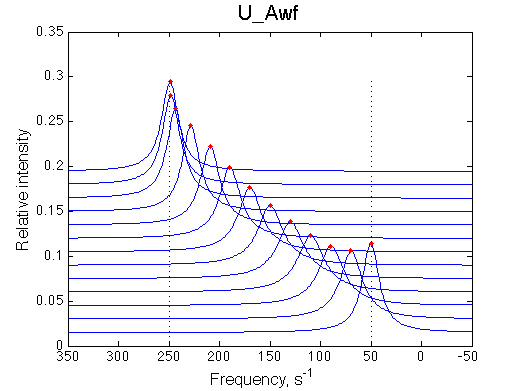
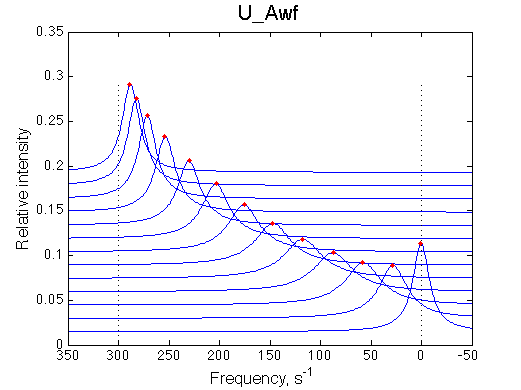
Simulated spectra
|
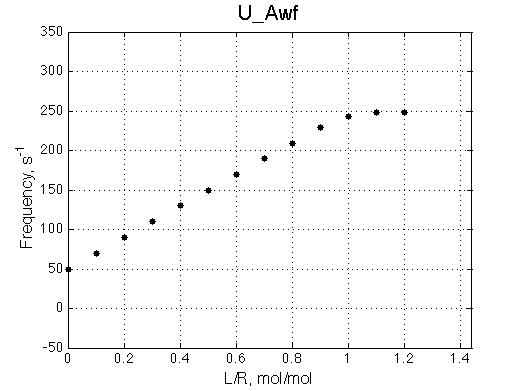
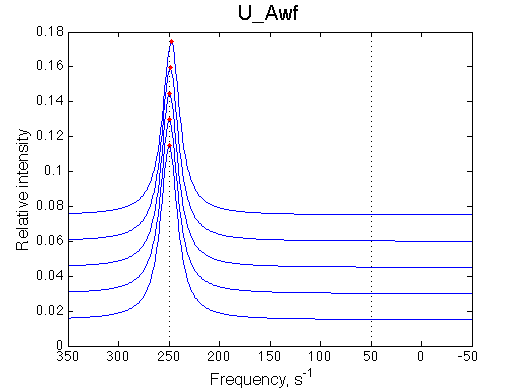
Chemical shift change upon titration
|
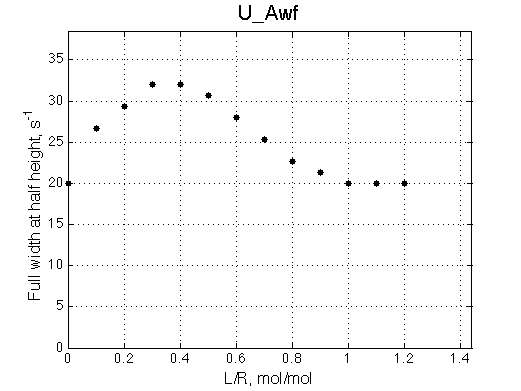
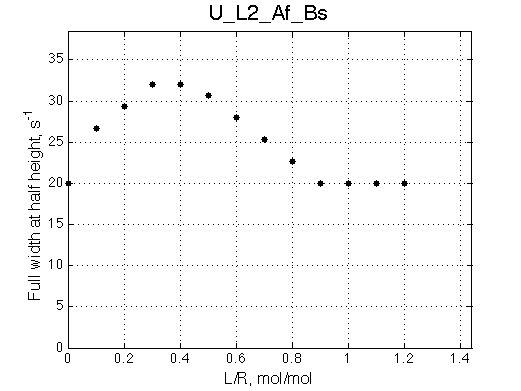
Line width change upon titration
|
| Line shapes shift gradually with some broadening in the middle of the series. | Chemical shift change is linear accurately following RL population change. | Line width peaks at about 0.35. This is characteristic for the U model. |
Fitting with the U model:
Optimum norm: 5.49e-03 |
||
Simulate U_setup_conc_dep_final U_Awf
Conclusion:
20x dilution of 2.5:1=L:R mixture does NOT influence the complex peak position.
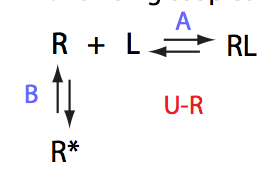
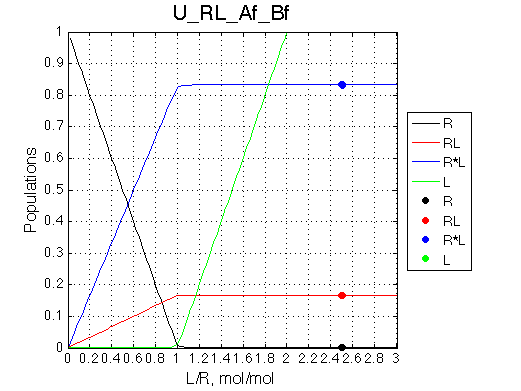
Simulate U_R_setup_conc_dep_final U_R_Af_Bf
Conclusion:
Due to weakened affinity, dilution at 2.5 L/R causes some complex dissociation and a slight peak shift.
Run two versions with opposite and same signs of ddH in A and B transitions (ddH=dH(final)-dH(initial)):
Simulate U_R_setup U_R_Af_Bf_inv_dH_B
Location: U_R/
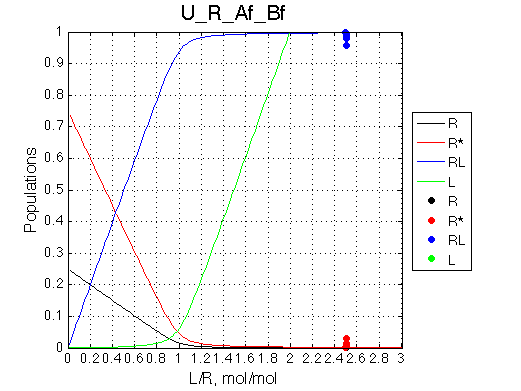
Calculated populations of species
|
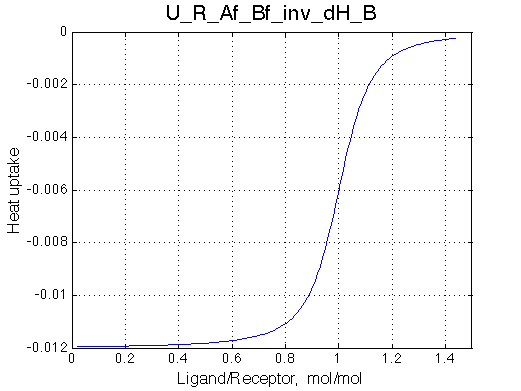
ITC profile assuming opposite signs of dH in A and B
|
ITC profile assuming the same sign of dH in A and B
|
| The receptor population is split with a constant ratio across the titration range. | R->R* and R->RL have the opposite signs of heat effects so R*->R->RL results in increased heat release. However, the shape of the curve stays symmetrical because there is no concentration dependence for R*->R process (to be analyzed in actual fitting). | When signs are the same, R->R* reduces heat effect of R->RL proporionally across the entire range of L/R. ITC profile remains symmetrical. |
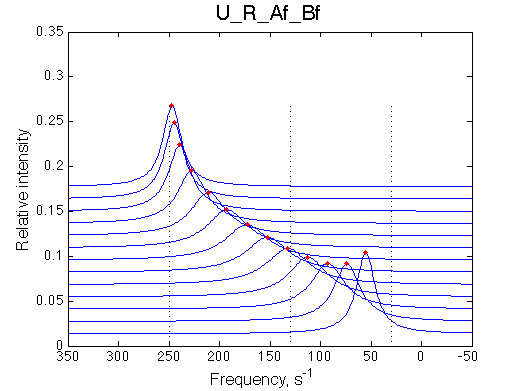
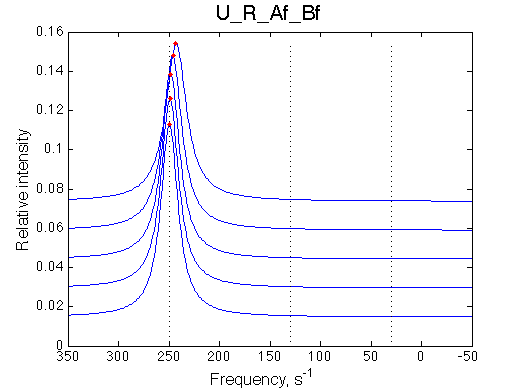
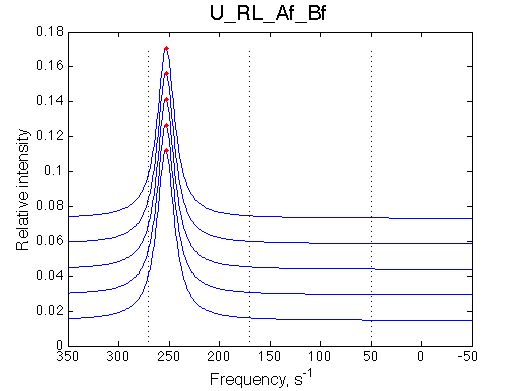
Simulated spectra
|
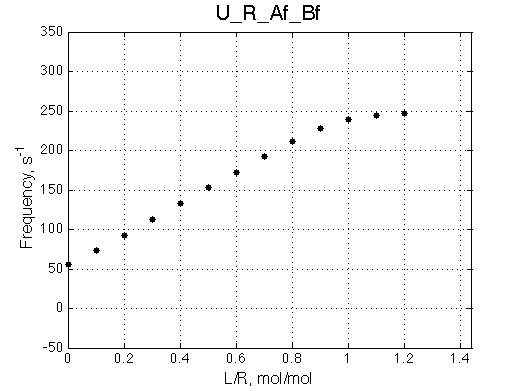
Chemical shift change upon titration
|
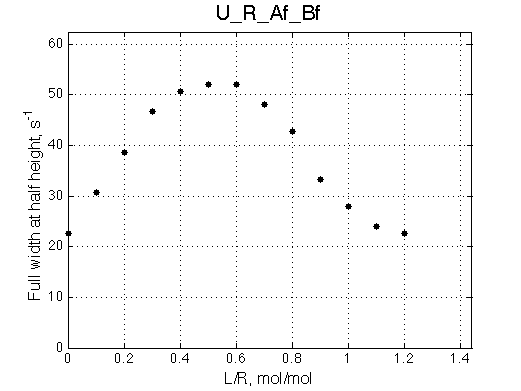
Line width change upon titration
|
| Titration curve is linear accurately following the RL population change. | Line width peaks at about 0.5 instead of 0.35, so poor fit with the U model may be predicted. | |
Fitting with the U model:
|
||
| Note a remarkable discrepancy between the 2-site U-model and U_R data due to the mismatch of the line-broadening effect across the L/R range. | ||
Choose:
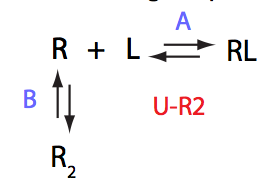
Simulate U_R2_conc_dep_setup U_R2_Af_Bf
Location: U_R2_conc_dep/
Comment:
Peaks shift towards the monomeric form upon 20x dilution.
Choose:
Simulate U_R2_setup_conc_dep_final U_R2_Af_Bf
Conclusion:
The final complex is stable against 20x dilution at L/R=2.5 because the binding affinity is NOT weakened when [R] is tiny.
Run two versions with opposite and same signs of ddH in A and B transitions (ddH=dH(final)-dH(initial)):
Simulate U_R2_setup U_R2_Af_Bf
Simulate U_R2_setup U_R2_Af_Bf_inv_dH_B
Location: U_R2/
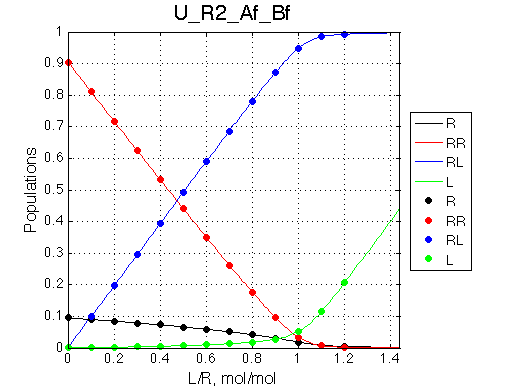
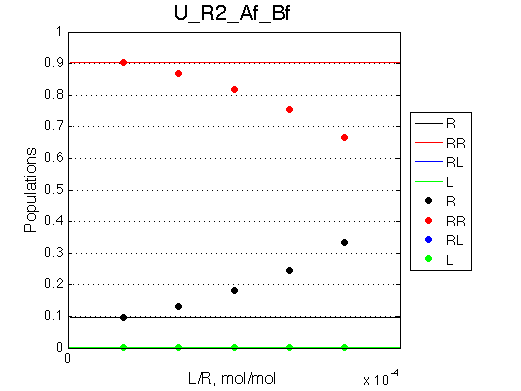
Calculated populations of species
Comment: Populations of the receptor species are significantly shifted towards dimer, but the ratio of dimer/monomer rapidly decreases with the titration progress. |
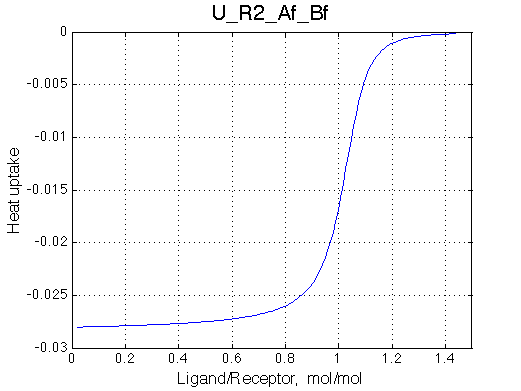
ITC profile assuming opposite signs of dH in A and B
Comment: Titration curver eveals larger heat release in the beginning of titration than in the end, because of the non-linear contribution from R->RR process, making the beginning of the transition curve less sharp and rendering the profile slightly asymmetrical. Stoichiometry as determined from the middle of the transition now deviates from 1 (about 1.05). |
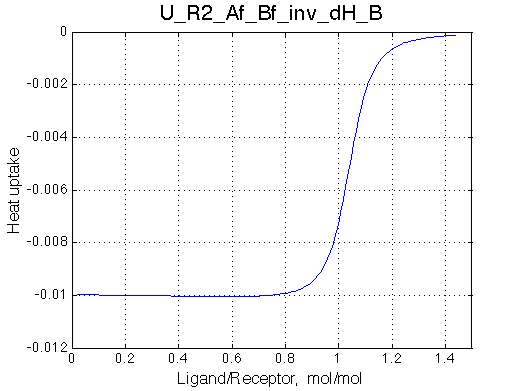
ITC profile assuming the same sign of dH in A and B
Comment: Disassembly of RR now compensates for R-RL heat, more in the beginning than in the end of L/R range generating a negative pre-transition slope and making beginning of the transition sharper than the end. Stoichiometry as determined from the middle of the transition also deviates from 1 (about 1.05). |
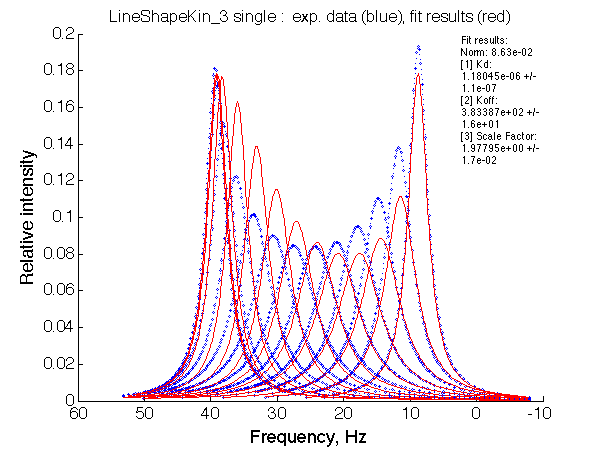
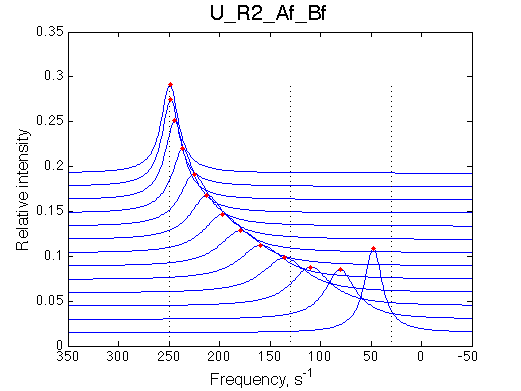
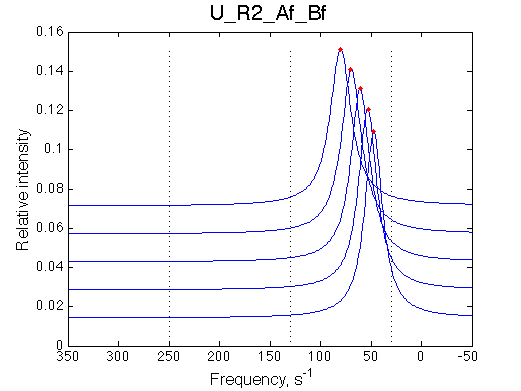
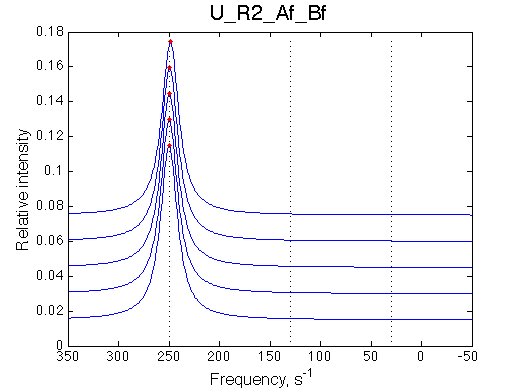
Simulated spectra
Comment: Line shapes look normal, in fast exchange. |
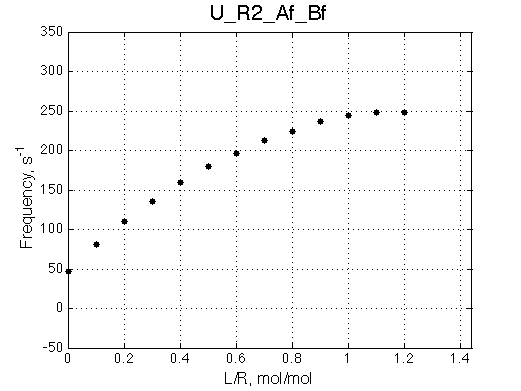
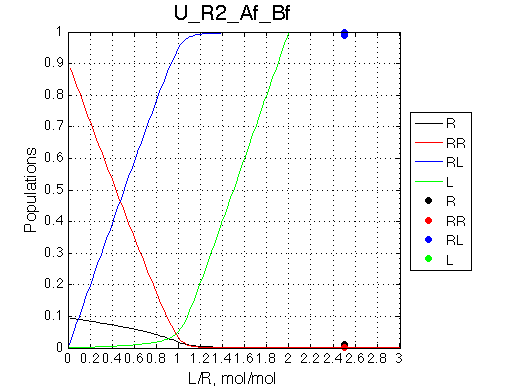
Chemical shift change upon titration
Comment: Note a non-linearity of the chemical shift plot. Poor fit with U model is expected. |
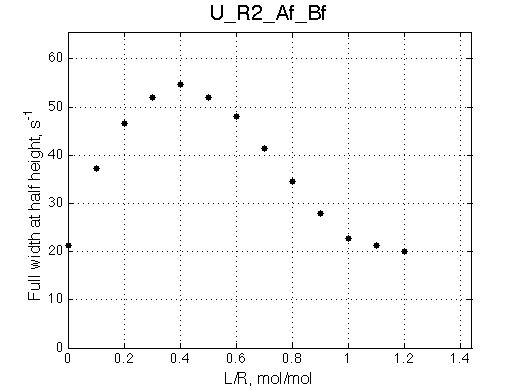
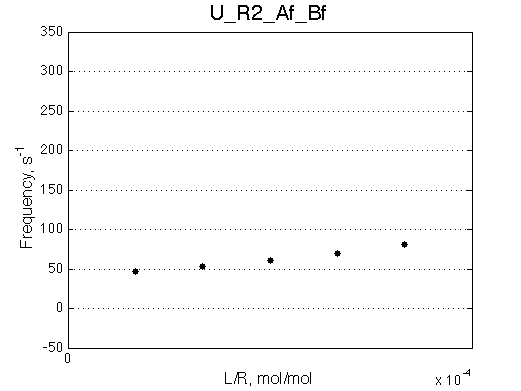
Line width change upon titration
Comment: Line broadening pattern is similar to the U model. |
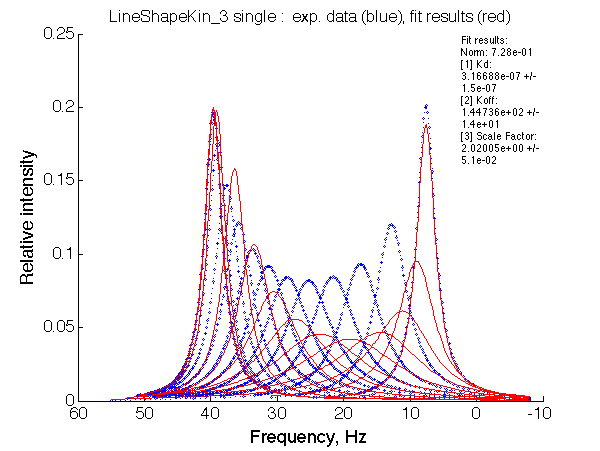
Fitting with the U model:
Comment: Dramatic discrepancy between the U model fit and U_R2 data originates from the non-linear peak shifts in the beginning of titration. |
||
Conclusion:
Combination of the concentration dependence and 2-site fit of a titration provide enough evidence for the U_R2 model
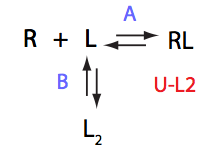
In this model kinetics of L<=>L* does not matter for the line shapes.
Choose:
Simulate U_L_setup_conc_dep_final U_L_Af_Bs
Conclusion:
Due to weakened affinity, dilution at 2.5 L/R causes some complex dissociation and a slight peak shift.
Location: U_L/
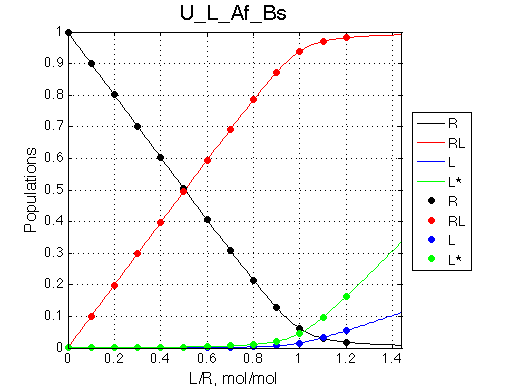
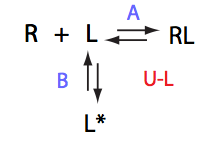
Calculated populations of species
Comment: The unbound ligand population is always split with the same ratio.
|
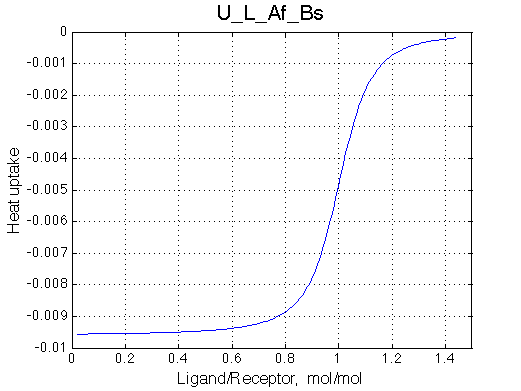
ITC profile
Comment: Titration curve is not accurate as heat effects of a titrant are not considered in this LineShapeKin Simulation version. |
|
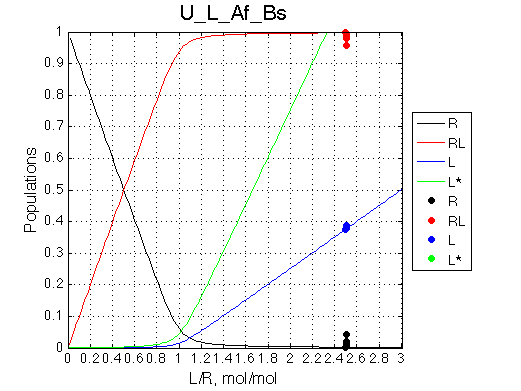
Simulated spectra
Comment: Line shapes are normal.
|
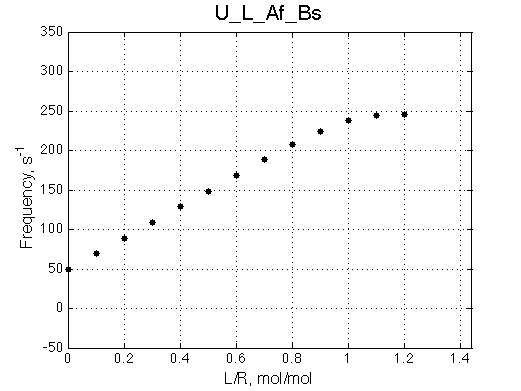
Chemical shift change upon titration
Comment: Chemical shift change is linear as in U model. |
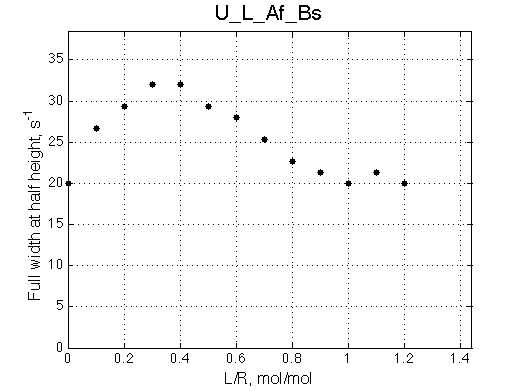
Line width change upon titration
Comment: Line-broadening effect matches the one originating from the U model. Good fit is expected. |
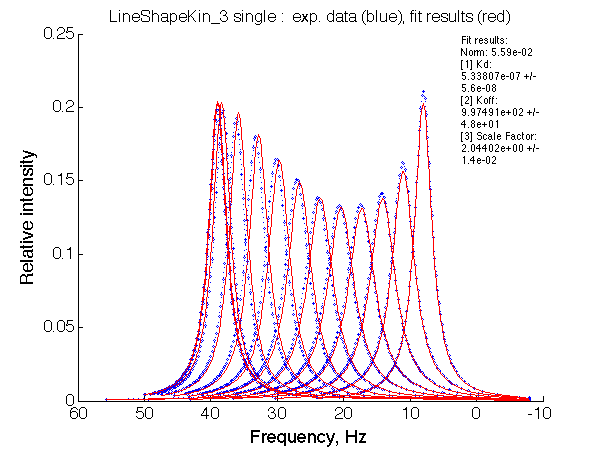
Fitting with the U model:
[1] Kd: 1.49764e-06 +/- 4.8e-08 Comment: The fit is remarkably good. Ka=1/Kd= 0.67e+06 versus Ka=1e6 used in the simulation. Ka is supposed to be scaled down by the competing formation of L*. Koff is accurate: 1040+-30/s vs. 1000/s used in the simulation. |
||
In this model kinetics of L<=>L* does not matter for the line shapes.
Choose:
Simulate U_L2_setup_conc_dep_final U_L2_Af_Bs
Conclusion
Dilution dramatically increases amount of the free ligand, which opposes dissociation of the complex.
Simulate U_L2_setup U_L2_Af_Bs
Location: U_L2/
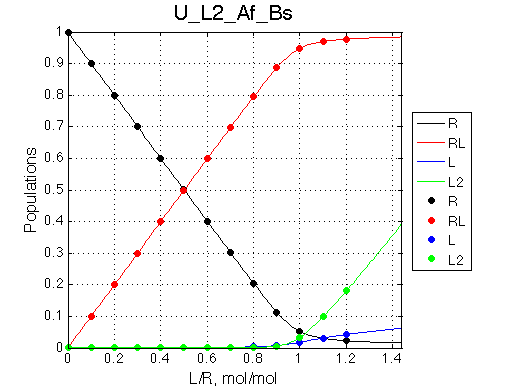
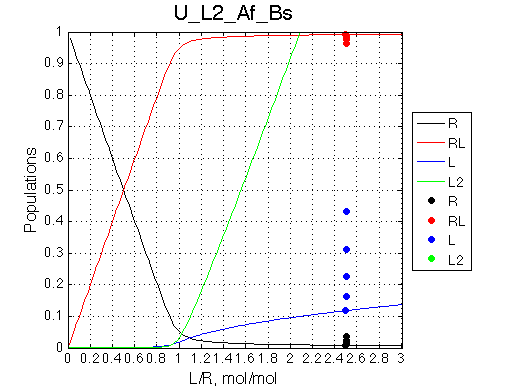
Calculated populations of species
Comment: Population of RL grows slightly differently than in U_L and U models after the saturation point because as free L concentration increases it is progressively withdrawn from the reaction to form non-binding L2 species. Thus, after equivalence point it becomes increasingly difficult to reach saturation (as if we were adding less and less ligand amounts with every next addition). |
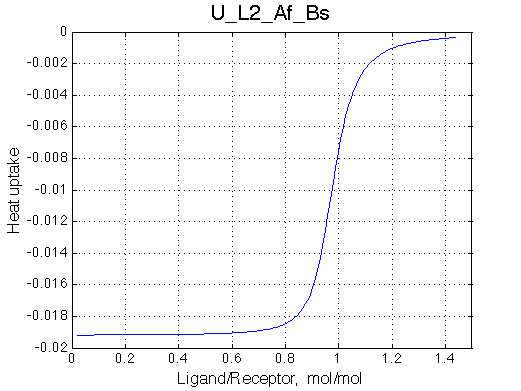
ITC profile assuming opposite signs of dH in A and B
Comment: |
ITC profile assuming the same sign of dH in A and B
Comment: |
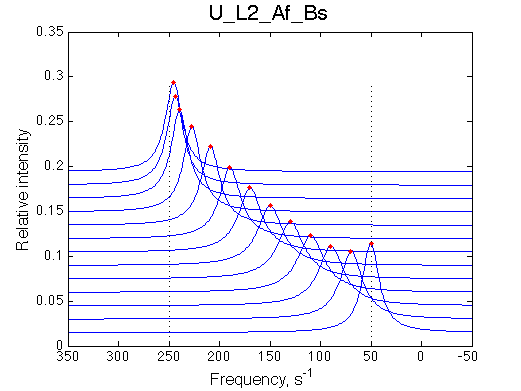
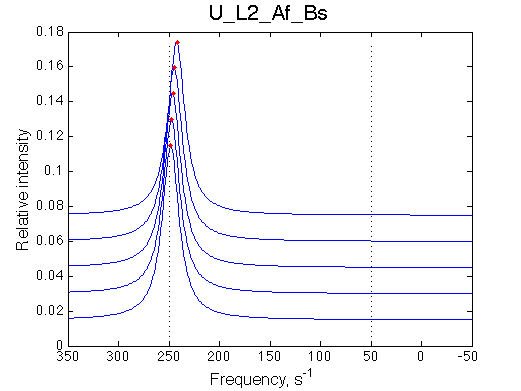
Simulated spectra
Comment:
|
Chemical shift change upon titration
Comment: |
Line width change upon titration
Comment: |
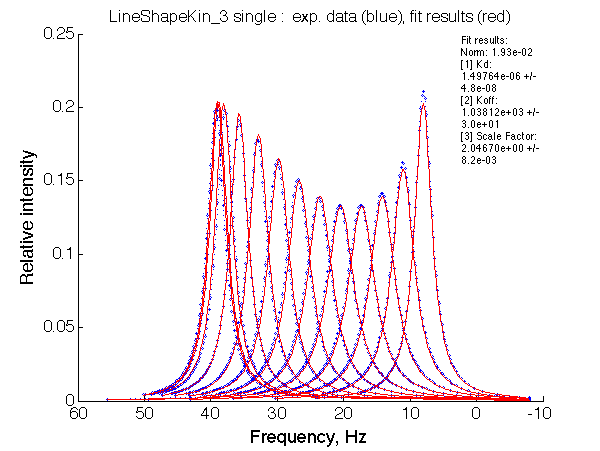
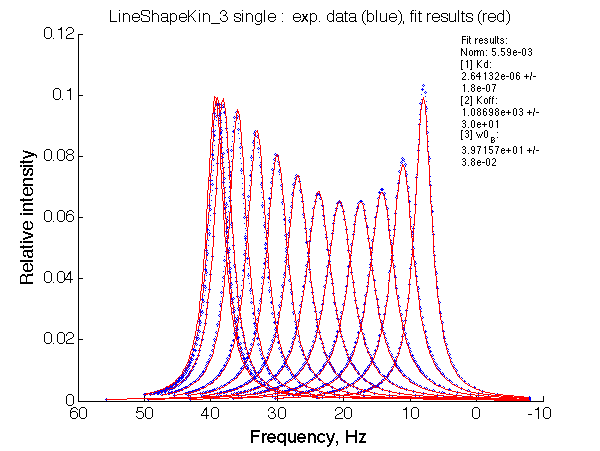
Fitting with the U model: Due to decreased apparent affinity the titration is not complete, so the final peak position is a poor estimate of the pure RL chemical shift. We need to fit dw(B). 1. Fit with fixed dw(B) to establish dw(B) estimate and the Scale Factor.
2. Use fitted Scale Factor and dw(B) and fit with the variable dw(B): 4.Matlab_fitting.Koff_Kd_w0B.fixed_SF/
Fit is much better now. [1] Kd: 2.64132e-06 +/- 1.8e-07 Ka=1/Kd = 0.37e6 vs. 1e6 used for simulation Koff=1090 /s - close to 1000/s used.
Comment: Line shapes contain little information about the mechanism. The major effect of dimerization in the free ligand, competing with binding, is reduction in the apparent binding affinity detected by line shape fitting. |
||
LRratio 2.501 2.502 2.503 2.504 2.505
Rtotal 1e-3 0.5e-3 0.25e-3 0.125e-3 0.06e-3
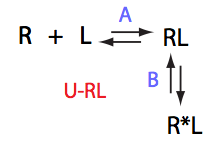
Simulate U_RL_setup_conc_dep_final U_RL_Af_Bf
Conclusion
Isomerization of the complex makes binding tighter opposing dissociation upon dilution
Run two versions with the opposite and same signs of ddH in A and B transitions (ddH=dH(final)-dH(initial)):
Simulate U_RL_setup U_RL_Af_Bf
Simulate U_RL_setup U_RL_Af_Bf_inv_dH_B
Location: U_RL/
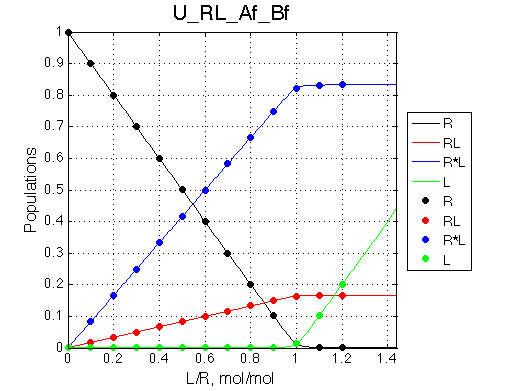
Calculated populations of species
Comment: Population of the complex is always split between two isomers with the same ratio.
|
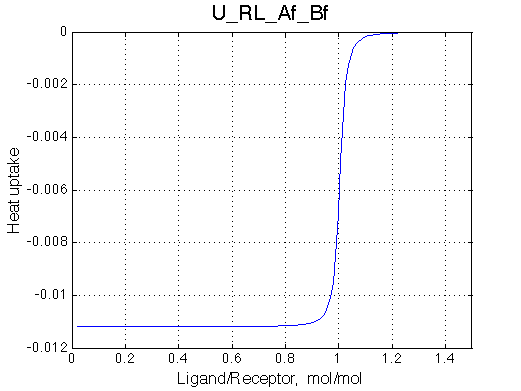
ITC profile assuming opposite signs of ddH in A and B
Comment: Formation of R*L compensates some of the binding heat resulting in smaller signal than in the case of the same signs (right). |
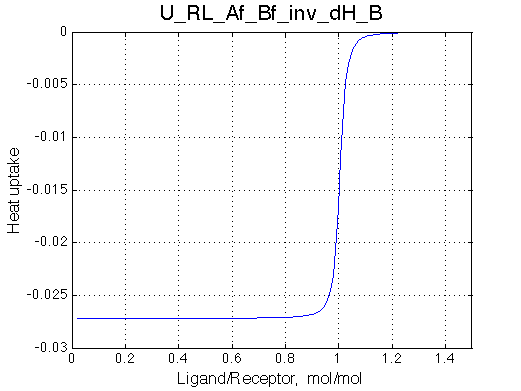
ITC profile assuming the same sign of ddH in A and B
Comment: |
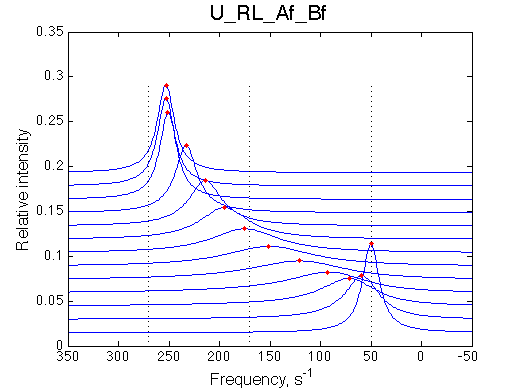
Simulated spectra
Comment: Line shapes look pretty normal
|
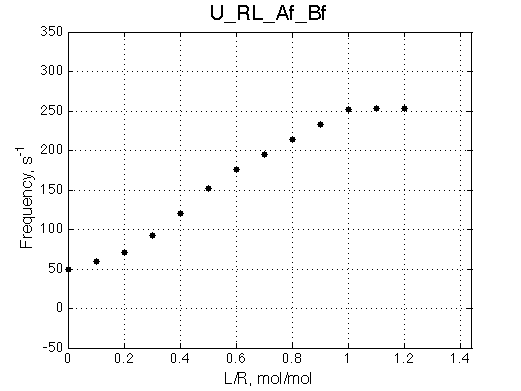
Chemical shift change upon titration
Comment: |
Line width change upon titration
Comment: Line-broadening peaks at 0.4 indicating that a good fit with 2-site model is expected. |
Fitting with the U model:
[1] Kd: 1.41354e-07 +/- 8.5e-09 Comment: The fit is relatively good, with a slight mismatch due to line width differences. Remarkable that Ka=1/Kd= 7e+06, which is 7x larger than 1e6 used in the simulation. In opposite, Koff=150/s, much slower than the k2(A)=1000/s and k2(B)=1000/s used in the simulation.
|
||
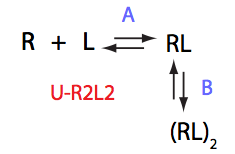
Choose:
Simulate U_R2L2_conc_dep_setup U_R2L2_Af_Bf
Location: U_R2L2_conc_dep/
Manually rescale X-axis on all graphs:
Comment:
Peak of the saturated receptor shifts significantly upon 20x dilution.
Run two versions with the opposite and same signs of ddH in A and B transitions (ddH=dH(final)-dH(initial)):
Simulate U_R2L2_setup U_R2L2_Af_Bf
Simulate U_R2L2_setup U_R2L2_Af_Bf_inv_dH
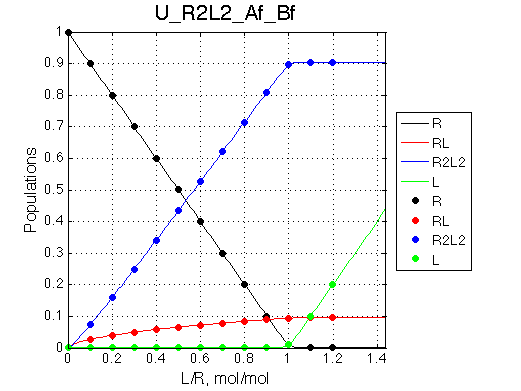
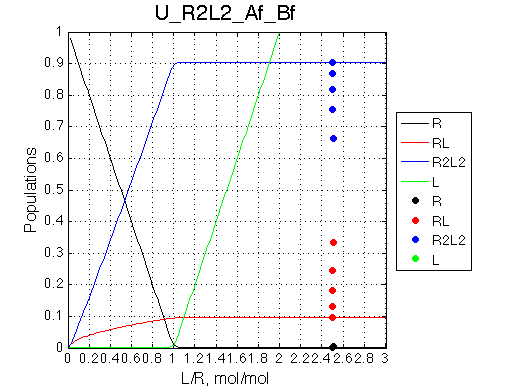
Calculated populations of species
Comment: Bound receptor population is split between the monomeric and dimeric species with dimer/monomer ratio progressively increasing with L/R. |
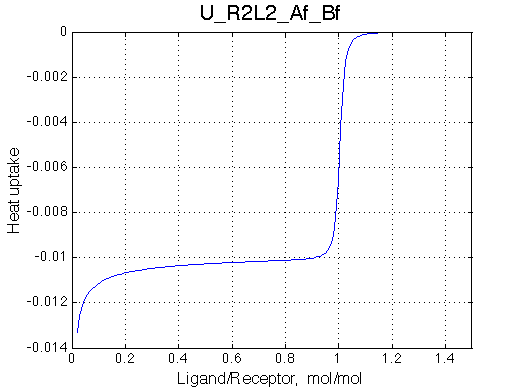
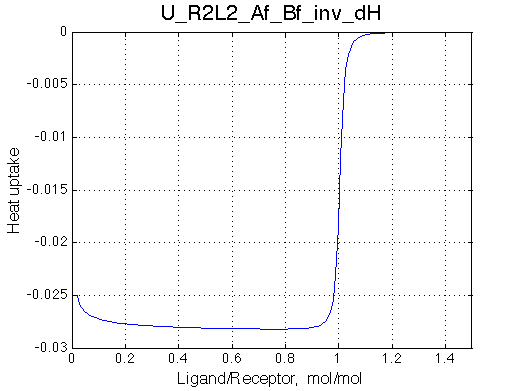
ITC profile assuming opposite signs of ddH in A and B
Comment: In the beginning when little dimer is formed the heat effect is maximal due to formation of RL. As concentration of RL rises and it begins to dimerize the opposite sign of dimerization heat leads to a reduction in total heat release due to titration. |
ITC profile assuming the same sign of ddH in A and B
Comment: Same but now a dimer formation progressively contributes more and more heat to the titration as saturation level increases. |
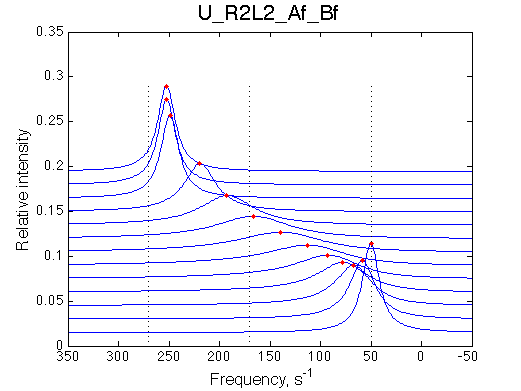
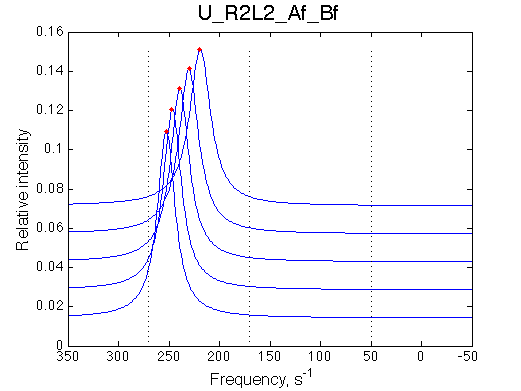
Simulated spectra
Comment: Line shapes look pretty normal.
|
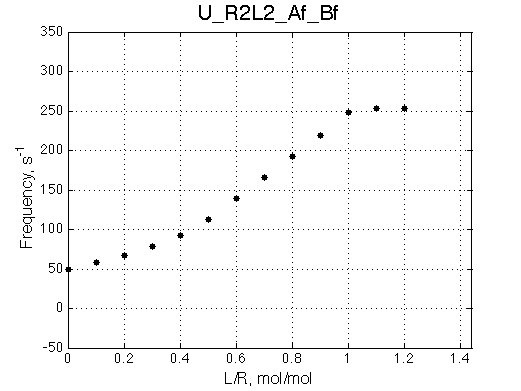
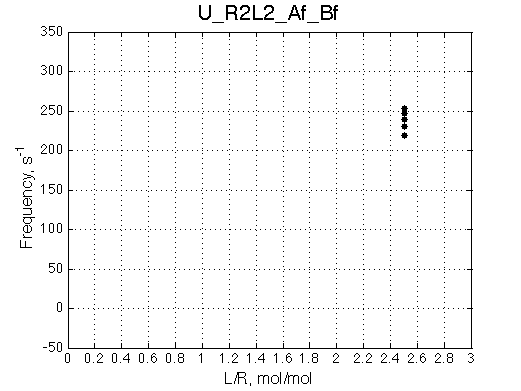
Chemical shift change upon titration
Comment: Non-linear chemical shift change will certainly make U-model fit poor. |
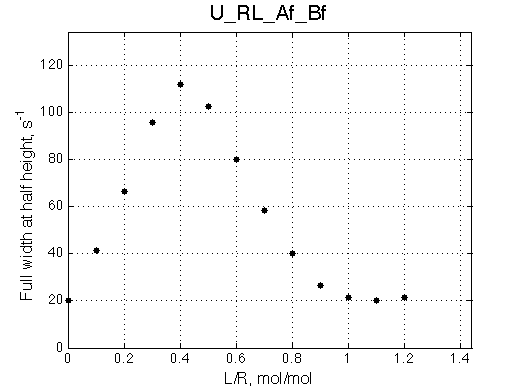
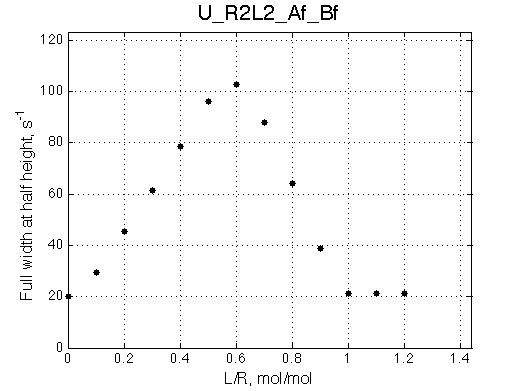
Line width change upon titration
Comment: Line-broadening effect is maximum at 0.6, which will make it incompatible with the U model (maximum at 0.35). |
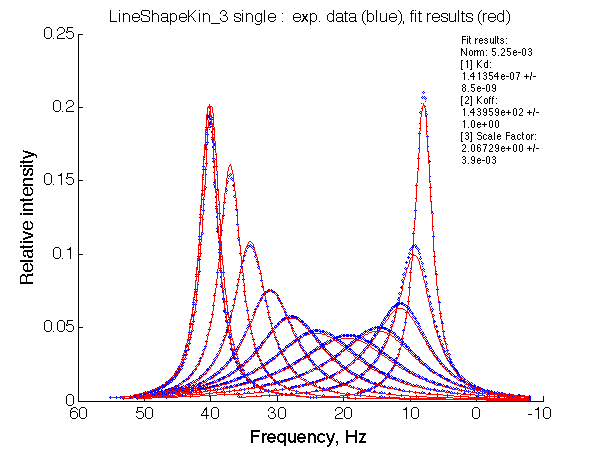
Fitting with the U model:
Comment: As expected from chemical shift change and the line-broadening distribution, the U-model fit fails miserably.
|
||
See side-by-side comparison here
Back to Analysis of Spectral Patterns