Location: tutorial_simulations/Spectral_patterns/2/
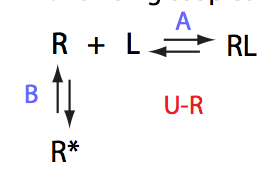
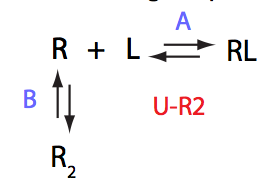
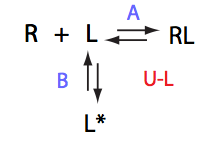
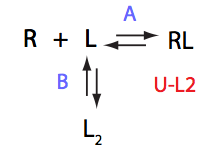
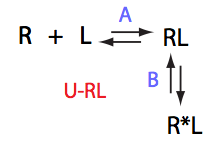
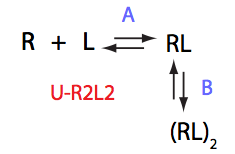
Here we will analyze all the models/conditions that give rise to a fast-exchange shifting resonance like the one depicted below.
picture
We will identify the distinct features of the line shapes originating from different models, which may helpful in establishing the 'dynamic identity' of the system. We will analyze peak positions, line widths and we will use fitting with the 2-site exchange model as a diagnostic tool.
Run two versions with the opposite and same signs of ddH in A and B transitions (ddH=dH(final)-dH(initial)):
Simulate
Calculated populations of species
Comment:
|
ITC profile assuming opposite signs of ddH in A and B
Comment: |
ITC profile assuming the same sign of ddH in A and B
Comment: |
Simulated spectra
Comment:
|
Chemical shift change upon titration
Comment: |
Line width change upon titration
Comment: |
Fitting with the U model:
Comment:
|
||

Back to Analysis of Spectral Patterns