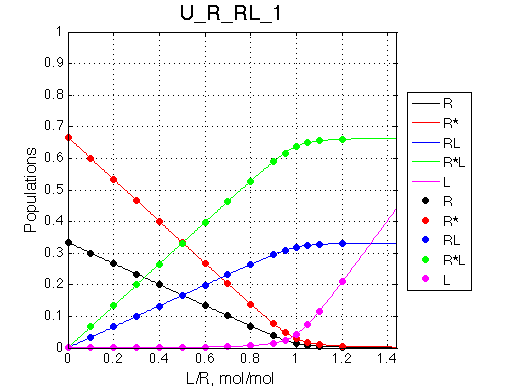
Equilibrium molar fractions of species
Other graphic formats: EPS, MATLAB Figure
Points correspond to steps in titration series corresponding to actual Rtotal and LRratio. Curves are smooth curves at constant Rtotal. Populations of multimeric species are shown per oligomer. Population of free ligand is normalized to total receptor concentration.
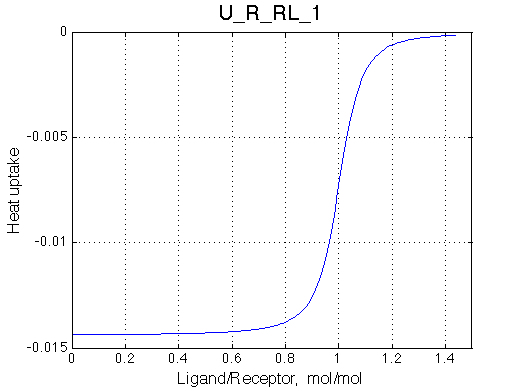
Isothermal Titration Calorimetry profile
Other graphic formats: EPS, MATLAB Figure
Heat uptake curve is simulated as a derivative of the populations.
U_R_RL_1
w1 < w2 < w3Ā < w4:Ā This site experiences both binding and isomerization changes
Equilibrium constants:
Ka(A1)=1.00e+06
Ka(B1)=2.00e+00
Ka(B2)=2.00e+00
Ka(A2)=1.00e+06 (dependent)
Rate constants (1-forward, 2-reverse):
k1(A1)=5.00e+08
k2(A1)=5.00e+02
k1(A2)=5.00e+08
k2(A2)=5.00e+02
k1(B1)=1.00e+03
k2(B1)=5.00e+02
k1(B2)=1.00e-02
k2(B2)=5.00e-03
Chemical shifts:
w0(R)=0.0 /s (0.0 Hz)
w0(R*)=100.0 /s (15.9 Hz)
w0(RL)=200.0 /s (31.8 Hz)
w0(R*L)=300.0 /s (47.8 Hz)
Base relaxation rates:
R2(R)=10.0 /s
R2(R*)=10.0 /s
R2(RL)=10.0 /s
R2(R*L)=10.0 /s
Enthalpy difference from the base state:
dH(R)=0.0
dH(R*)=-1.0
dH(RL)=-2.0
dH(R*L)=-3.0
Total R concentration (*1000):
0.50 0.50 0.50 0.50 0.50 0.50 0.50 0.50 0.50 0.50 0.50 0.50 0.50 0.50 0.50
Ratio of total L to total R:
0.00 0.10 0.20 0.30 0.40 0.50 0.60 0.70 0.80 0.90 0.95 1.00 1.05 1.10 1.20
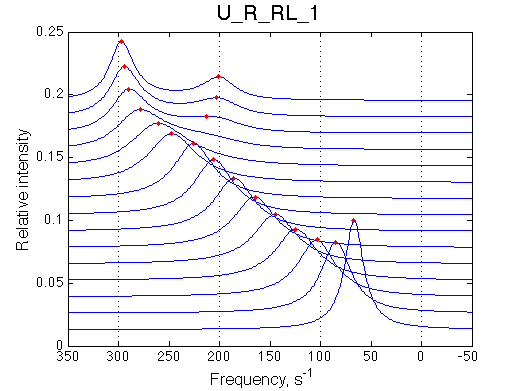
1D-spectra of the titration series
Other graphic formats: EPS, MATLAB Figure
Traces (bottom to top) correspond to L/R ratios indicated by points in the Populations graph (above). Red dots indicate peak maxima for a visual aid (also plotted as the chemical shift titration curves, right). Dashed lines indicate chemical shifts of individual species.
Chemical shift titration curves

Other graphic formats: EPS, MATLAB Figure
Points correspond to positions of peak maxima numerically detected in the spectral traces. Sometimes not all peaks will be detected. Signal/noise is not considered.