Testing of the U_L model
by Evgenii Kovrigin, 6/1/2011
Contents
close all
clear all
Here you will find all figures
figures_folder='U_L_testing_figures';
TEST COMPUTATION OF EQUILIBRIUM POPULATIONS
Set some meaningful parameters
Rtotal=1e-3; % Receptor concentration, M
LRratio_array=[0 : 0.02 : 1.45]; % Array of L/R
K_a_A=1e6;  % Binding affinity constant
K_a_B=4;  % Isomerization constant

% Set appropriate options for the model (see model file for details)
model_numeric_solver='analytical'  ;
model_numeric_options='none';
Compute arrays for populations and plot
concentrations_array=[];
for counter=1:length(LRratio_array)
    % compute
    [concentrations species_names] = equilibrium_thermodynamic_equations.U_L_model(...
        Rtotal, LRratio_array(counter), K_a_A, K_a_B,...
        model_numeric_solver, model_numeric_options);
    % collect
    concentrations_array = [concentrations_array ; concentrations];
end
Plot
Figure_title= 'U-L model';
X_range=[0 max(LRratio_array)+0.1 ]; % extend X just a bit past last point
Y_range=[ ]; % keep automatic scaling for Y
% display figure
figure_handle=equilibrium_thermodynamic_equations.plot_populations(...
    LRratio_array, concentrations_array, species_names, Figure_title, X_range, Y_range);
% save it
results_output.output_figure(figure_handle, figures_folder, 'Concentrations_plot');
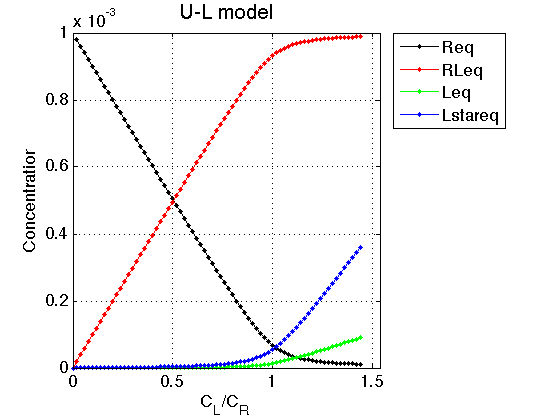
Observations The result is exactly what we expect from this model. Free ligand is split between two forms: binding-competent L and incompetent L*. As the receptor approaches saturation, amount of free ligand increases but ratio between L and L* remains constant.
Test influence of high K_a_B on binding equilibrium
Set some meaningful parameters
Rtotal=1e-3; % Receptor concentration, M
LRratio_array=[0 : 0.02 : 1.45]; % Array of L/R
K_a_A=1e6;  % Binding affinity constant
K_a_B=1000;  % Isomerization constant

% Set appropriate options for the model (see model file for details)
model_numeric_solver='analytical'  ;
model_numeric_options='none';
Compute arrays for populations and plot
concentrations_array=[];
for counter=1:length(LRratio_array)
    % compute
    [concentrations species_names] = equilibrium_thermodynamic_equations.U_L_model(...
        Rtotal, LRratio_array(counter), K_a_A, K_a_B,...
        model_numeric_solver, model_numeric_options);
    % collect
    concentrations_array = [concentrations_array ; concentrations];
end
Plot
Figure_title= 'U-L: high KB';
X_range=[0 max(LRratio_array)+0.1 ]; % extend X just a bit past last point
Y_range=[ ]; % keep automatic scaling for Y
% display figure
figure_handle=equilibrium_thermodynamic_equations.plot_populations(...
    LRratio_array, concentrations_array, species_names, Figure_title, X_range, Y_range);
% save it
results_output.output_figure(figure_handle, figures_folder, 'Concentrations_plot_highKB');
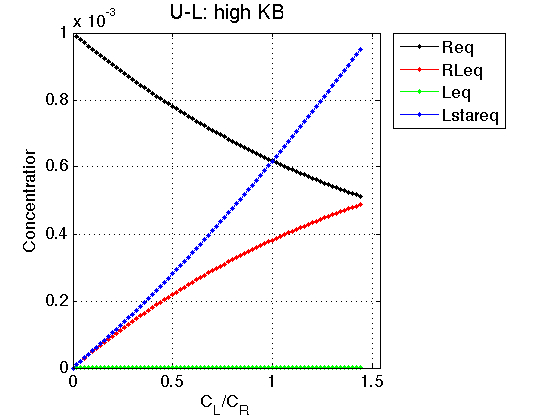
We see that if equilirium in L is strongly shifted towards non-binding L* the binding proceeds as very weak-affinity process due to low availability of the binding-competent L.
Conclusion
The model equilibrium_thermodynamic_equations.U_L_model() works well.