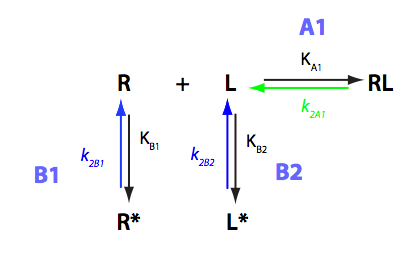
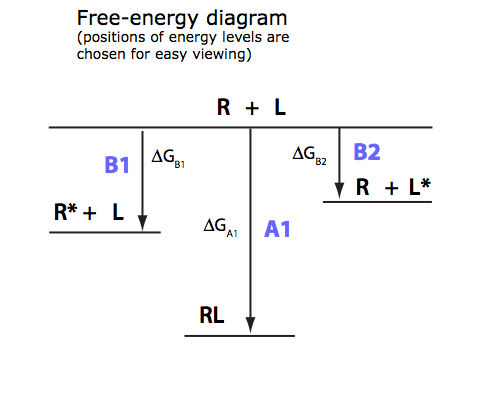
Analysis of U-R-L model
Binding coupled with intramolecular isomerization of both receptor and a ligand into unbinding conformations
In this notebook I will analyze U-R-L model using derivations performed in
Equilibria/U_R_L_model/U_R_L_derivation.mn
clean up workspace
reset()
Set path to save results into:
ProjectName:="U_R_L";
CurrentPath:="/Users/kovrigin/Documents/Workspace/Data/Data.XV/EKM16.Analysis_of_multistep_kinetic_mechanisms/Equilibria/U_R_L_model/";
![]()
![]()
Read results of derivations
filename:=CurrentPath.ProjectName.".mb";
fread(filename,Quiet):
![]()
anames(All,User);

Plot all on one graph
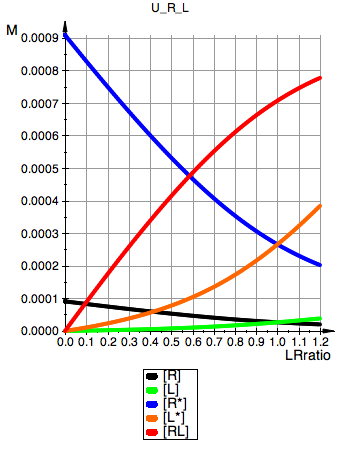
Total_R:=1e-3:
Total_L:=0.5e-3:
Ka1:=1e6:
Kb1:=10:
Kb2:=10:
// display parameters
LRratio_max:=1.2:
LW:=1.5:
pReq:= plot::Function2d(
Function=(fReq_U_R_L(Total_R, Total_R*LRratio, Ka1, Kb1, Kb2)),
LegendText="[R]",
Color = RGB::Black,
XMin=(0),
XMax=(LRratio_max),
XName=(LRratio),
TitlePositionX=(0),
LineWidth=LW):
pLeq:= plot::Function2d(
Function=(fLeq_U_R_L(Total_R, Total_R*LRratio, Ka1, Kb1, Kb2)),
LegendText="[L]",
Color = RGB::Green,
XMin=(0),
XMax=(LRratio_max),
XName=(LRratio),
TitlePositionX=(0),
LineWidth=LW):
pRstareq:= plot::Function2d(
Function=(fRstareq_U_R_L(Total_R, Total_R*LRratio, Ka1, Kb1, Kb2)),
LegendText="[R*]",
Color = RGB::Blue,
XMin=(0),
XMax=(LRratio_max),
XName=(LRratio),
TitlePositionX=(0),
LineWidth=LW):
pLstareq:= plot::Function2d(
Function=(fLstareq_U_R_L(Total_R, Total_R*LRratio, Ka1, Kb1, Kb2)),
LegendText="[L*]",
Color = RGB::Orange,
XMin=(0),
XMax=(LRratio_max),
XName=(LRratio),
TitlePositionX=(0),
LineWidth=LW):
pRLeq:= plot::Function2d(
Function=(fRLeq_U_R_L(Total_R, Total_R*LRratio, Ka1, Kb1, Kb2)),
LegendText="[RL]",
Color = RGB::Red,
XMin=(0),
XMax=(LRratio_max),
XName=(LRratio),
TitlePositionX=(0),
LineWidth=LW):
// Report constants
print(Unquoted,ProjectName);
print(Unquoted,"Total_R:=".Total_R.":");
print(Unquoted,"Ka1:=".Ka1.":");
print(Unquoted,"Kb1:=".Kb1.":");
print(Unquoted,"Kb2:=".Kb2.":");
plot(pReq, pLeq, pRstareq, pLstareq, pRLeq,
YAxisTitle="M", Header=ProjectName,
Height=160, Width=120,TicksLabelFont=["Helvetica",12,[0,0,0],Left],
AxesTitleFont=["Helvetica",14,[0,0,0],Left],
XGridVisible=TRUE, YGridVisible=TRUE,
LegendVisible=TRUE, LegendFont=["Helvetica",14,[0,0,0],Left]);
U_R_L
Total_R:=0.001:
Ka1:=1000000.0:
Kb1:=10:
Kb2:=10:
Jump back to 2D plotting header
Window
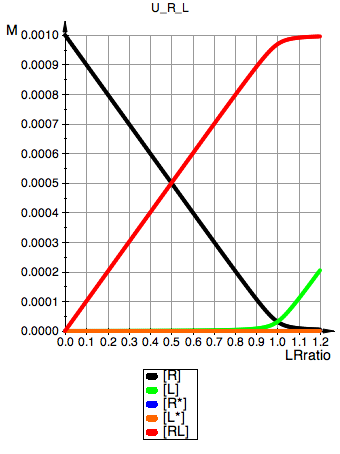
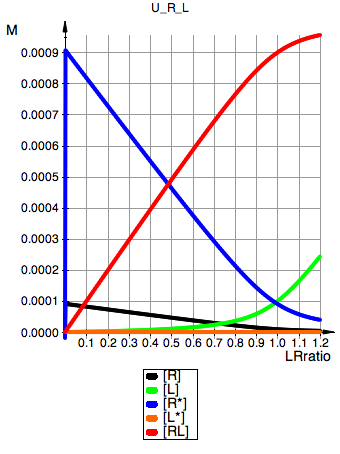
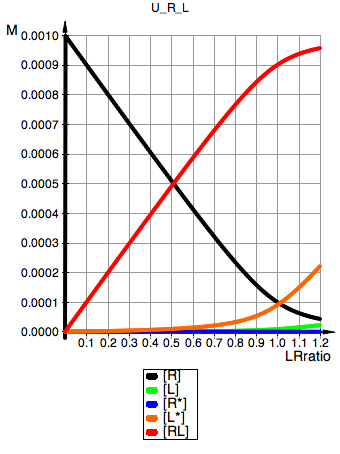
Simple test results
|
No R* nor L* |
No L* |
No R* |
Both R* and L* are populated |
|
|
U_R_L Total_R:=0.001: Ka1:=1000000.0: Kb1:=0: Kb2:=0:
|
U_R_L Total_R:=0.001: Ka1:=1000000.0: Kb1:=10: Kb2:=0:
|
U_R_L Total_R:=0.001: Ka1:=1000000.0: Kb1:=0: Kb2:=10:
|
U_R_L Total_R:=0.001: Ka1:=1000000.0: Kb1:=10: Kb2:=10:
|
|
Conclusions
1. The equations work as expected.
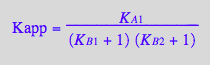
2. Increasing equilibrium constants of isomerization for either binding partner leads to a decrease in apparent binding affinity as prescribed by
Kapp_U_R_L