Analysis of U-R-RL-RM
(numeric solution required)
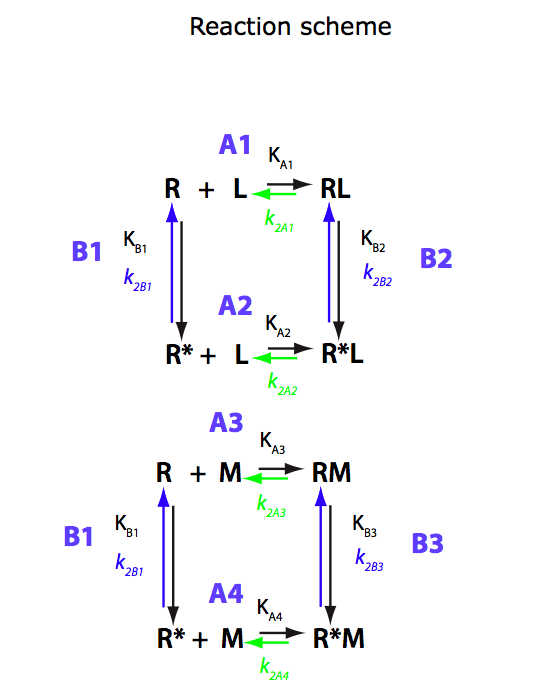
Binding of two mutually exclusive ligands coupled with intramolecular isomerization of the receptor (competitive ligand binding)
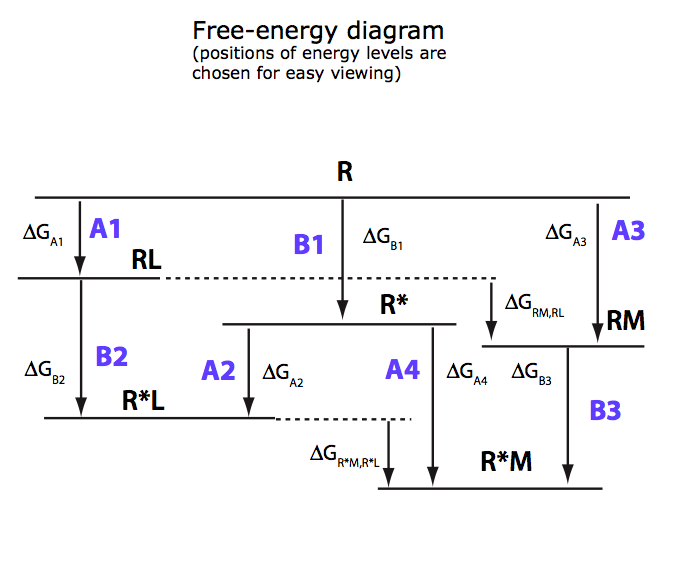
(images from Equilibrium_models/U-R-RL-RM_model.pdf)
`
In this notebook I will analyze U-R-RL-RM model using numeric solutions from
EKM16.Analysis_of_multistep_kinetic_mechanisms/Equilibria/LRIM_U_R_RL_RM_derivation.mn
clean up workspace
reset()
Set path to save results into:
ProjectName:="U_R_RL_RM";
CurrentPath:="/Users/kovrigin/Documents/Workspace/Data/Data.XV/EKM16.Analysis_of_multistep_kinetic_mechanisms/Equilibria/";
![]()
![]()
Read results of derivations
filename:=CurrentPath.ProjectName.".mb";
fread(filename,Quiet):
anames(User);
![]()

Test procedures
Assume some constant values and evaluate
Total_R:=1e-3:
Ka1:=1e7:
Ka3:=1e6:
Kb1:=2/1:
Kb2:=0.1:
Kb3:=0.1:
LRratio_max:=1.2:
MRratio_max:=1.2:
// some test point
LRratio:=0.95:
MRratio:=0.95:
pnLeq_U_R_RL_RM(Total_R, LRratio, MRratio, Ka1, Ka3, Kb1, Kb2, Kb3);
pnMeq_U_R_RL_RM(Total_R, LRratio, MRratio, Ka1, Ka3, Kb1, Kb2, Kb3);
pnReq_U_R_RL_RM(Total_R, LRratio, MRratio, Ka1, Ka3, Kb1, Kb2, Kb3);
pnRLeq_U_R_RL_RM(Total_R, LRratio, MRratio, Ka1, Ka3, Kb1, Kb2, Kb3);
pnRMeq_U_R_RL_RM(Total_R, LRratio, MRratio, Ka1, Ka3, Kb1, Kb2, Kb3);
pnRstareq_U_R_RL_RM(Total_R, LRratio, MRratio, Ka1, Ka3, Kb1, Kb2, Kb3);
pnRstarLeq_U_R_RL_RM(Total_R, LRratio, MRratio, Ka1, Ka3, Kb1, Kb2, Kb3);
pnRstarMeq_U_R_RL_RM(Total_R, LRratio, MRratio, Ka1, Ka3, Kb1, Kb2, Kb3);
![]()
![]()
![]()
![]()
![]()
![]()
![]()
![]()
OK
Make wrapper functions for plotting
// Make wrapper functions dependent on LRratio
fnLeqL:=LRratio -> pnLeq_U_R_RL_RM(Total_R, LRratio, MRratio, Ka1, Ka3, Kb1, Kb2, Kb3):
fnMeqL:=LRratio -> pnMeq_U_R_RL_RM(Total_R, LRratio, MRratio, Ka1, Ka3, Kb1, Kb2, Kb3):;
fnReqL:=LRratio -> pnReq_U_R_RL_RM(Total_R, LRratio, MRratio, Ka1, Ka3, Kb1, Kb2, Kb3):
fnRLeqL:=LRratio -> pnRLeq_U_R_RL_RM(Total_R, LRratio, MRratio, Ka1, Ka3, Kb1, Kb2, Kb3):
fnRMeqL:=LRratio -> pnRMeq_U_R_RL_RM(Total_R, LRratio, MRratio, Ka1, Ka3, Kb1, Kb2, Kb3):
fnRstareqL:=LRratio -> pnRstareq_U_R_RL_RM(Total_R, LRratio, MRratio, Ka1, Ka3, Kb1, Kb2, Kb3):
fnRstarLeqL:=LRratio -> pnRstarLeq_U_R_RL_RM(Total_R, LRratio, MRratio, Ka1, Ka3, Kb1, Kb2, Kb3):
fnRstarMeqL:=LRratio -> pnRstarMeq_U_R_RL_RM(Total_R, LRratio, MRratio, Ka1, Ka3, Kb1, Kb2, Kb3):
// Make wrapper functions dependent on MRratio
fnLeqM:=MRratio -> pnLeq_U_R_RL_RM(Total_R, LRratio, MRratio, Ka1, Ka3, Kb1, Kb2, Kb3):
fnMeqM:=MRratio -> pnMeq_U_R_RL_RM(Total_R, LRratio, MRratio, Ka1, Ka3, Kb1, Kb2, Kb3):;
fnReqM:=MRratio -> pnReq_U_R_RL_RM(Total_R, LRratio, MRratio, Ka1, Ka3, Kb1, Kb2, Kb3):
fnRLeqM:=MRratio -> pnRLeq_U_R_RL_RM(Total_R, LRratio, MRratio, Ka1, Ka3, Kb1, Kb2, Kb3):
fnRMeqM:=MRratio -> pnRMeq_U_R_RL_RM(Total_R, LRratio, MRratio, Ka1, Ka3, Kb1, Kb2, Kb3):
fnRstareqM:=MRratio -> pnRstareq_U_R_RL_RM(Total_R, LRratio, MRratio, Ka1, Ka3, Kb1, Kb2, Kb3):
fnRstarLeqM:=MRratio -> pnRstarLeq_U_R_RL_RM(Total_R, LRratio, MRratio, Ka1, Ka3, Kb1, Kb2, Kb3):
fnRstarMeqM:=MRratio -> pnRstarMeq_U_R_RL_RM(Total_R, LRratio, MRratio, Ka1, Ka3, Kb1, Kb2, Kb3):
Test plotting
delete LRratio, MRratio; // clean up to be able to use identifier again
Total_R:=0.001:
Ka1:=1000000.0:
//Ka2:=6000000.0 (dependent)
Ka3:=1000000.0:
//Ka4:=300000.0 (dependent)
Kb1:=1e-32:
Kb2:=1e-32:
Kb3:=1e-32:
LW:=1.5:
LRratio_max:=2:
MRratio_max:=2:
MRratio:=1e-16:
pReqL:= plot::Function2d(
Function=(fnReqL),
LegendText="[R]",
Color = RGB::Blue,
XMin=(0),
XMax=(LRratio_max),
XName=(LRratio),
TitlePositionX=(0),
LineWidth=LW):
pRLeqL:= plot::Function2d(
Function=(fnRLeqL),
LegendText="[RL]",
Color = RGB::Red,
XMin=(0),
XMax=(LRratio_max),
XName=(LRratio),
TitlePositionX=(0),
LineWidth=LW):
plot(pReqL,pRLeqL,LegendVisible=TRUE);
delete MRratio; // clean up to be able to use identifier again
LRratio:=1e-16:
pReqM:= plot::Function2d(
Function=(fnReqM),
LegendText="[RL]",
Color = RGB::Blue,
XMin=(0),
XMax=(MRratio_max),
XName=(MRratio),
TitlePositionX=(0),
LineWidth=LW):
pRMeqM:= plot::Function2d(
Function=(fnRMeqM),
LegendText="[RM]",
Color = RGB::Red,
XMin=(0),
XMax=(MRratio_max),
XName=(MRratio),
TitlePositionX=(0),
LineWidth=LW):
plot(pReqM,pRMeqM,LegendVisible=TRUE);
delete LRratio; // clean up to be able to use identifier again
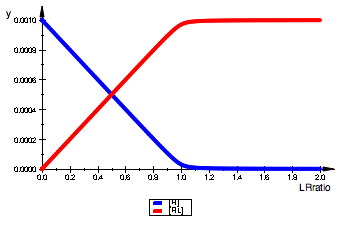
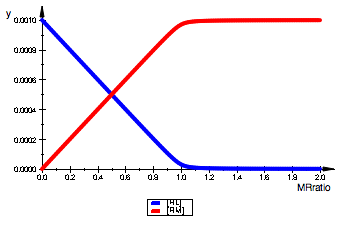
Functions are symmetrical for LRratio and MRratio=1e-16.
Assume some constant values and evaluate titrations with both L and M. I am looking for complete symmetry as a proof of correct derivation.
delete LRratio, MRratio; // clean up to be able to use identifier again
Total_R:=0.001:
MR_Ratio:=0.5: // for titration with L
LR_Ratio:=0.5: // for titration with M
Ka1:=1000000.0:
//Ka2:=6000000.0 (dependent)
Ka3:=1000000.0:
//Ka4:=300000.0 (dependent)
Kb1:=2:
Kb2:=1/3:
Kb3:=1/3:
// Plotting parameters
LW:=1.5:
LRratio_max:=2:
MRratio_max:=2:
// Compute dependent constants
Ka2:=KA2_U_R_RL_RM[2] | K_A_1=Ka1 | K_B_1=Kb1 | K_B_2=Kb2:
Ka4:=KA4_U_R_RL_RM[2] | K_A_3=Ka3 | K_B_1=Kb1 | K_B_3=Kb3:
// Make plots for titration with L
MRratio:=MR_Ratio:
pLeqL:= plot::Function2d(
Function=(fnLeqL),
LegendText="[L]",
Color = RGB::Yellow,
XMin=(0),
XMax=(LRratio_max),
XName=(LRratio),
TitlePositionX=(0),
LineWidth=LW):
pMeqL:= plot::Function2d(
Function=(fnMeqL),
LegendText="[M]",
Color = RGB::Orange,
XMin=(0),
XMax=(LRratio_max),
XName=(LRratio),
TitlePositionX=(0),
LineWidth=LW):
pReqL:= plot::Function2d(
Function=(fnReqL),
LegendText="[R]",
Color = RGB::Black,
XMin=(0),
XMax=(LRratio_max),
XName=(LRratio),
TitlePositionX=(0),
LineWidth=LW):
pRLeqL:= plot::Function2d(
Function=(fnRLeqL),
LegendText="[RL]",
Color = RGB::Blue,
XMin=(0),
XMax=(LRratio_max),
XName=(LRratio),
TitlePositionX=(0),
LineWidth=LW):
pRMeqL:= plot::Function2d(
Function=(fnRMeqL),
LegendText="[RM]",
Color = RGB::Cyan,
XMin=(0),
XMax=(LRratio_max),
XName=(LRratio),
TitlePositionX=(0),
LineWidth=LW):
pRstareqL:= plot::Function2d(
Function=(fnRstareqL),
LegendText="[R*]",
Color = RGB::Red,
XMin=(0),
XMax=(LRratio_max),
XName=(LRratio),
TitlePositionX=(0),
LineWidth=LW):
pRstarLeqL:= plot::Function2d(
Function=(fnRstarLeqL),
LegendText="[R*L]",
Color = RGB::Magenta,
XMin=(0),
XMax=(LRratio_max),
XName=(LRratio),
TitlePositionX=(0),
LineWidth=LW):
pRstarMeqL:= plot::Function2d(
Function=(fnRstarMeqL),
LegendText="[R*M]",
Color = RGB::Gray,
XMin=(0),
XMax=(LRratio_max),
XName=(LRratio),
TitlePositionX=(0),
LineWidth=LW):
// Report constants
print(Unquoted,ProjectName.", Titration with L");
print(Unquoted,"Total_R:=".Total_R.":");
print(Unquoted,"MRratio:=".MRratio.":");
print(Unquoted,"Ka1:=".Ka1.":");
print(Unquoted,"//Ka2:=".Ka2." (dependent)");
print(Unquoted,"Ka3:=".Ka3.":");
print(Unquoted,"//Ka4:=".Ka4." (dependent)");
print(Unquoted,"Kb1:=".Kb1.":");
print(Unquoted,"Kb2:=".Kb2.":");
print(Unquoted,"Kb3:=".Kb3.":");
// plot all together
plot(pLeqL, pMeqL, pReqL, pRLeqL, pRMeqL,
pRstareqL, pRstarLeqL, pRstarMeqL,
YAxisTitle="M", Header=(ProjectName.", Titration with L"),
Height=200, Width=160,TicksLabelFont=["Helvetica",12,[0,0,0],Left],
AxesTitleFont=["Helvetica",14,[0,0,0],Left],
XGridVisible=TRUE, YGridVisible=TRUE,
LegendVisible=TRUE, LegendFont=["Helvetica",14,[0,0,0],Left]);
// Make plots for titration with M
delete MRratio, LRratio; // clean up identifiers
LRratio:=LR_Ratio:
pLeqM:= plot::Function2d(
Function=(fnLeqM),
LegendText="[L]",
Color = RGB::Yellow,
XMin=(0),
XMax=(MRratio_max),
XName=(MRratio),
TitlePositionX=(0),
LineWidth=LW):
pMeqM:= plot::Function2d(
Function=(fnMeqM),
LegendText="[M]",
Color = RGB::Orange,
XMin=(0),
XMax=(MRratio_max),
XName=(MRratio),
TitlePositionX=(0),
LineWidth=LW):
pReqM:= plot::Function2d(
Function=(fnReqM),
LegendText="[R]",
Color = RGB::Black,
XMin=(0),
XMax=(MRratio_max),
XName=(MRratio),
TitlePositionX=(0),
LineWidth=LW):
pRLeqM:= plot::Function2d(
Function=(fnRLeqM),
LegendText="[RL]",
Color = RGB::Blue,
XMin=(0),
XMax=(MRratio_max),
XName=(MRratio),
TitlePositionX=(0),
LineWidth=LW):
pRMeqM:= plot::Function2d(
Function=(fnRMeqM),
LegendText="[RM]",
Color = RGB::Cyan,
XMin=(0),
XMax=(MRratio_max),
XName=(MRratio),
TitlePositionX=(0),
LineWidth=LW):
pRstareqM:= plot::Function2d(
Function=(fnRstareqM),
LegendText="[R*]",
Color = RGB::Red,
XMin=(0),
XMax=(MRratio_max),
XName=(MRratio),
TitlePositionX=(0),
LineWidth=LW):
pRstarLeqM:= plot::Function2d(
Function=(fnRstarLeqM),
LegendText="[R*L]",
Color = RGB::Magenta,
XMin=(0),
XMax=(MRratio_max),
XName=(MRratio),
TitlePositionX=(0),
LineWidth=LW):
pRstarMeqM:= plot::Function2d(
Function=(fnRstarMeqM),
LegendText="[R*M]",
Color = RGB::Gray,
XMin=(0),
XMax=(MRratio_max),
XName=(MRratio),
TitlePositionX=(0),
LineWidth=LW):
// Report constants
print(Unquoted,ProjectName.", Titration with M");
print(Unquoted,"Total_R:=".Total_R.":");
print(Unquoted,"LRratio:=".LRratio.":");
print(Unquoted,"Ka1:=".Ka1.":");
print(Unquoted,"//Ka2:=".Ka2." (dependent)");
print(Unquoted,"Ka3:=".Ka3.":");
print(Unquoted,"//Ka4:=".Ka4." (dependent)");
print(Unquoted,"Kb1:=".Kb1.":");
print(Unquoted,"Kb2:=".Kb2.":");
print(Unquoted,"Kb3:=".Kb3.":");
// plot all together
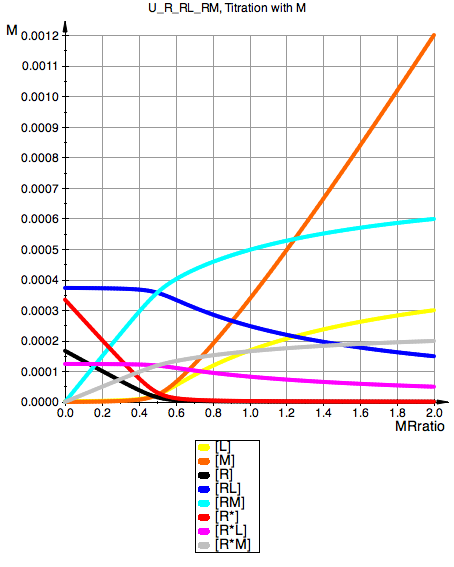
plot(pLeqM, pMeqM, pReqM, pRLeqM, pRMeqM,
pRstareqM, pRstarLeqM, pRstarMeqM,
YAxisTitle="M", Header=ProjectName.", Titration with M",
Height=200, Width=160,TicksLabelFont=["Helvetica",12,[0,0,0],Left],
AxesTitleFont=["Helvetica",14,[0,0,0],Left],
XGridVisible=TRUE, YGridVisible=TRUE,
LegendVisible=TRUE, LegendFont=["Helvetica",14,[0,0,0],Left]);
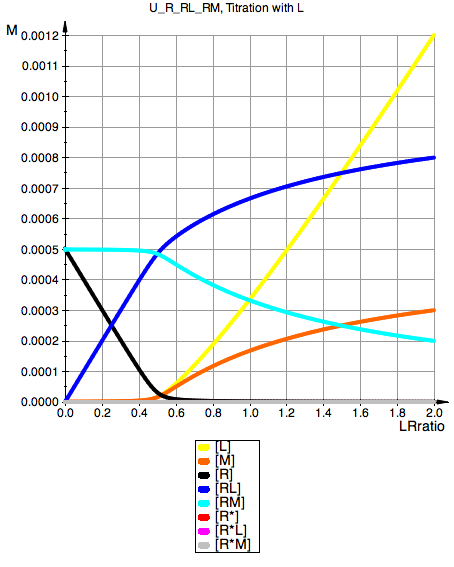
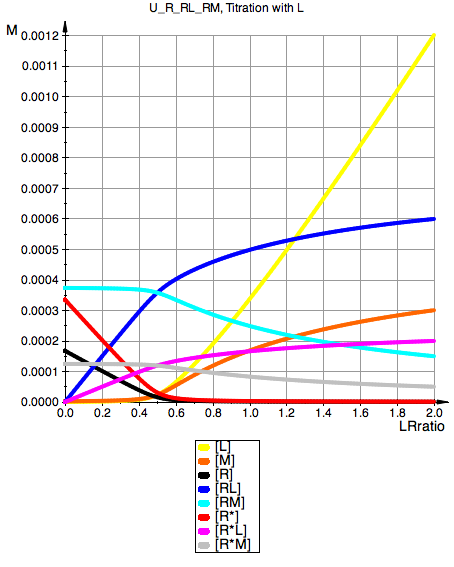
U_R_RL_RM, Titration with L
Total_R:=0.001:
MRratio:=0.5:
Ka1:=1000000.0:
//Ka2:=166666.6667 (dependent)
Ka3:=1000000.0:
//Ka4:=166666.6667 (dependent)
Kb1:=2:
Kb2:=1/3:
Kb3:=1/3:

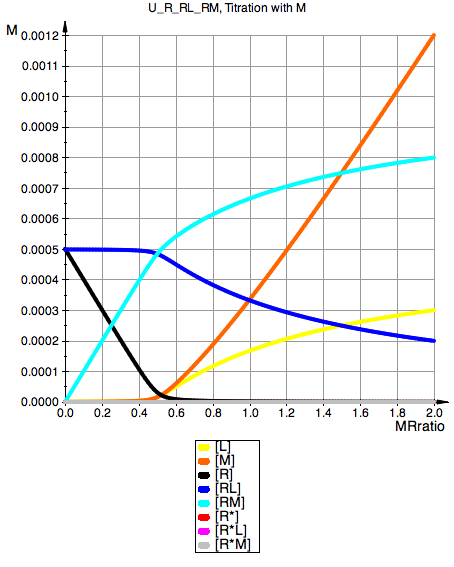
U_R_RL_RM, Titration with M
Total_R:=0.001:
LRratio:=0.5:
Ka1:=1000000.0:
//Ka2:=166666.6667 (dependent)
Ka3:=1000000.0:
//Ka4:=166666.6667 (dependent)
Kb1:=2:
Kb2:=1/3:
Kb3:=1/3:
Jump to beginning of simulation
For convenience of handling multiple plots I will collect results of different simulations in a separate document
Equilibria/U_R_RL_simulations_summary.mn
Test symmetry in different situations
Jump to beginning of simulation
|
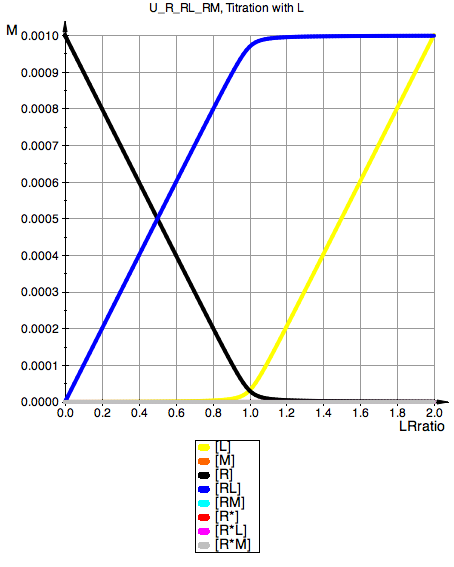
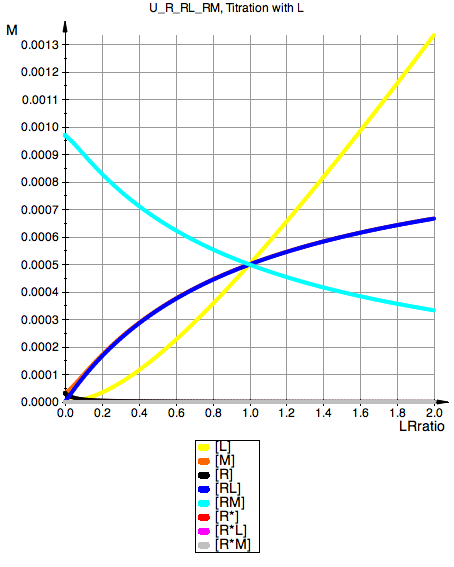
U_R_RL_RM, Titration with L Total_R:=0.001: MRratio:=1.0e-16: Ka1:=1000000.0: //Ka2:=1000000.0 (dependent) Ka3:=1000000.0: //Ka4:=1000000.0 (dependent) Kb1:=1.0e-32: Kb2:=1.0e-32: Kb3:=1.0e-32:
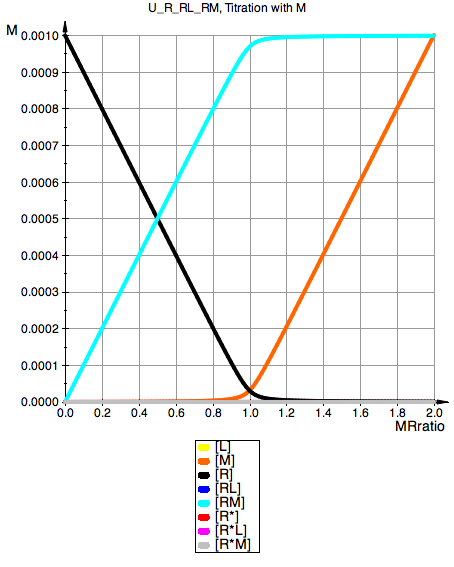
|
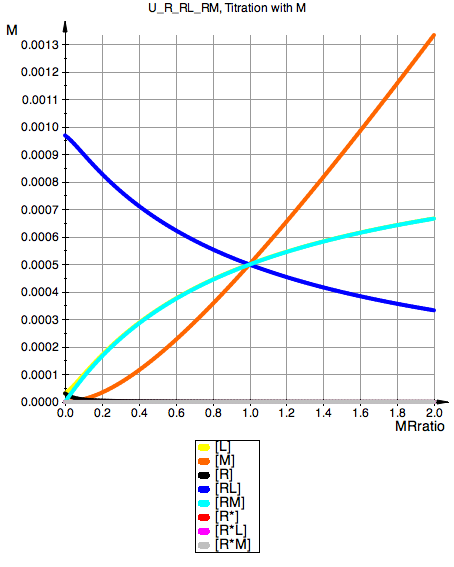
U_R_RL_RM, Titration with M Total_R:=0.001: LRratio:=1.0e-16: Ka1:=1000000.0: //Ka2:=1000000.0 (dependent) Ka3:=1000000.0: //Ka4:=1000000.0 (dependent) Kb1:=1.0e-32: Kb2:=1.0e-32: Kb3:=1.0e-32:
|
|
|
|
U_R_RL_RM, Titration with L Total_R:=0.001: MRratio:=0.25: Ka1:=1000000.0: //Ka2:=1000000.0 (dependent) Ka3:=1000000.0: //Ka4:=1000000.0 (dependent) Kb1:=1.0e-32: Kb2:=1.0e-32: Kb3:=1.0e-32:
|
U_R_RL_RM, Titration with M Total_R:=0.001: LRratio:=0.25: Ka1:=1000000.0: //Ka2:=1000000.0 (dependent) Ka3:=1000000.0: //Ka4:=1000000.0 (dependent) Kb1:=1.0e-32: Kb2:=1.0e-32: Kb3:=1.0e-32:
|
|
|
|
U_R_RL_RM, Titration with L Total_R:=0.001: MRratio:=0.5: Ka1:=1000000.0: //Ka2:=1000000.0 (dependent) Ka3:=1000000.0: //Ka4:=1000000.0 (dependent) Kb1:=1.0e-32: Kb2:=1.0e-32: Kb3:=1.0e-32:
|
U_R_RL_RM, Titration with M Total_R:=0.001: LRratio:=0.5: Ka1:=1000000.0: //Ka2:=1000000.0 (dependent) Ka3:=1000000.0: //Ka4:=1000000.0 (dependent) Kb1:=1.0e-32: Kb2:=1.0e-32: Kb3:=1.0e-32:
|
|
|
|
U_R_RL_RM, Titration with L Total_R:=0.001: MRratio:=1: Ka1:=1000000.0: //Ka2:=1000000.0 (dependent) Ka3:=1000000.0: //Ka4:=1000000.0 (dependent) Kb1:=1.0e-32: Kb2:=1.0e-32: Kb3:=1.0e-32:
|
U_R_RL_RM, Titration with M Total_R:=0.001: LRratio:=1: Ka1:=1000000.0: //Ka2:=1000000.0 (dependent) Ka3:=1000000.0: //Ka4:=1000000.0 (dependent) Kb1:=1.0e-32: Kb2:=1.0e-32: Kb3:=1.0e-32:
|
|
|
|
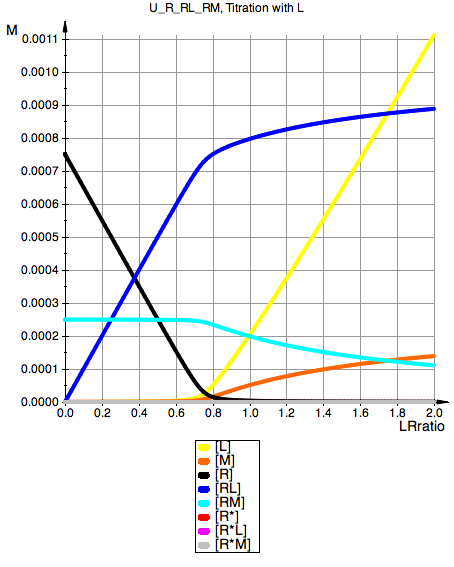
U_R_RL_RM, Titration with L Total_R:=0.001: MRratio:=0.5: Ka1:=1000000.0: //Ka2:=166666.6667 (dependent) Ka3:=1000000.0: //Ka4:=166666.6667 (dependent) Kb1:=2: Kb2:=1/3: Kb3:=1/3:
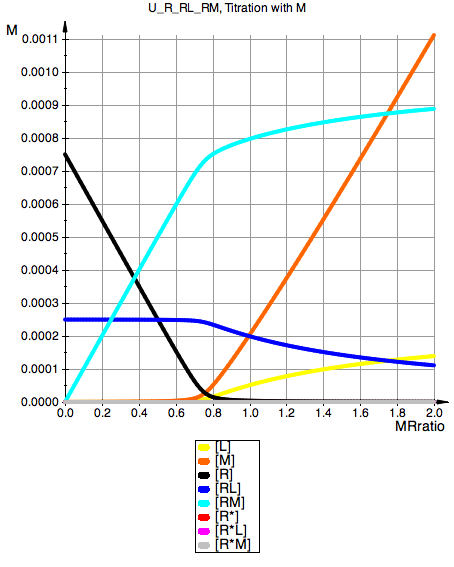
|
U_R_RL_RM, Titration with M Total_R:=0.001: LRratio:=0.5: Ka1:=1000000.0: //Ka2:=166666.6667 (dependent) Ka3:=1000000.0: //Ka4:=166666.6667 (dependent) Kb1:=2: Kb2:=1/3: Kb3:=1/3:
|
|
|
|
|
|
|
|
|
|
|
|
|
|
|
|
|
|
|
|
|
|
|
|
|
|
|
|
Jump to beginning of simulation
Conclusion:
Equations are completely symmetrical proving correctness of derivations
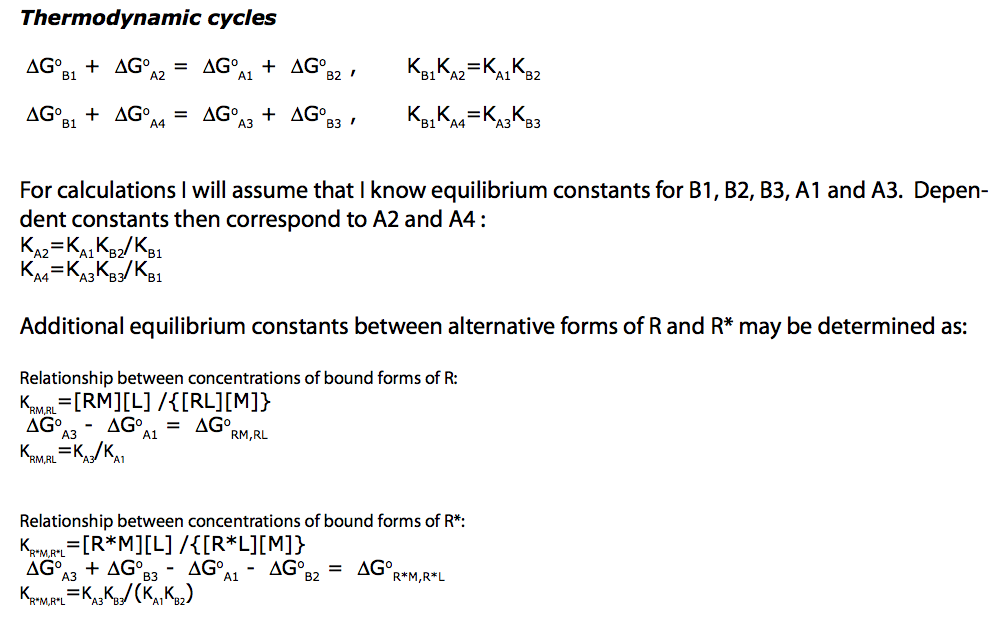
Conclusions
1.The equation for numeric analysis confirm correctness of derivations
2. Results of different simulations are collected in a separate document
Equilibria/U_R_RL_simulations_summary.mn