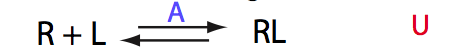
Simulate setup U_RL_Af_Bi


Here we will compare outcomes of the four alternative models for conditions when binding is weak and the off-rate is fast. The isomerization is chosen to be slow here. I choose binding affinity of 106 M-1 and the off-rate constant of 500 s-1. R and RL are separated by 100 s-1 and R* or R*L - by 100 s-1 from corresponding species. Isomerization equilibrium is shifted 5:1 toward *-forms. The reverse isomerization rate is 17 s-1 to make kex =100 s-1 .
Location:Af_Bi/
|
|
|
|
Simulate setup U_RL_Af_Bi |
|||
|
|
|
|
|
|
|
|
|
|
|
|
|
|
|
|
| Note remarkable narrowing of the peak in the very beginning of titration! | Similar to U model | Notice remarkable narrowing of the peak near the end of titration! |
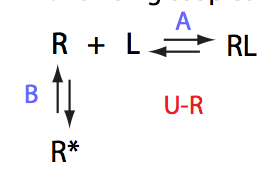
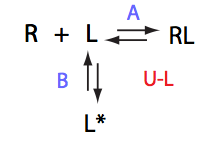
NOTE: The transient narrowing of the line shapes in U_R and U_RL models is only happening if *-isomer chemical shift is in between the R and RL chemical shifts as can be seen below:
|
|
Simulate setup U_R_Af_Bi_reverse_chem_shifts |
Simulate setup U_RL_Af_Bi_reverse_chemical_shifts |
 |
 |
 |
 |
 |
 |
| Shifting of the final peak is a remarkable feature. Shifting of the initial peak is small inversely proportional to the R*/R. | Shifting of the initial peak is a remarkable feature. Shifting of the final peak is small inversely proportional to the RL*/RL. The FWHH of the final peak sharply decreases at the end. |
The models produce very feature-rich lineshapes. Forward and reverse titrations will enable sensitive distinction between the models.
k2(B), s-1 |
k2(B)= 0.1 s-1
|
k2(B)= 1 s-1
|
k2(B)= 10 s-1
|
k2(B)= 30 s-1
|
k2(B)= 60 s-1
|
k2(B)= 120 s-1
|
k2(B)= 240 s-1 | k2(B)= 500 s-1 | k2(B)= 1000 s-1 |
Setup setup_U_R_fancy_lineshapes U_R_Af_Bi_fancy_lineshapes7 |
Setup setup_U_R_fancy_lineshapes U_R_Af_Bi_fancy_lineshapes8 |
Setup setup_U_R_fancy_lineshapes U_R_Af_Bi_fancy_lineshapes9 |
|||||||
| slow exchange conditions help us see the average resonance of R and RL moving through the R* resonance | Exchange between R and R* is in intermediate regime (kex=60) and significant narrowing of the overlapped line is seen at L/R=0.1, 0.2 | Exchange between R and R* is faster so the peak at L/R=0 becomes narrower while the overlapped resonance at 0.1 and 0.2 stays same narrow (visual narrowing effect disappears). | The R-R* exchange is fast now, now visual narrowing is seen but the line widths are significantly different from what U-model would produce | ||||||
 |
 |
 |
 |
 |
 |
 |
 |
 |
|
 |
 |
 |
 |
 |
 |
 |
 |
 |
|
 |
 |
 |
 |
 |
 |
 |
 |
 |
plotdatasets 'U_R_fancy_lineshapes6' 'L/R' 'FWHH,/s'

Reason to the significant narrowing of the peak in the initial steps after ligand addition is that the fast-exchange resonance between R and RL shifts and overlaps with the position of R*. When k2 accelerates so the exchange between R and R* becomes intermediate and the significant narrowing of the average peak between all three states is observed. As k2 further accelerates the initial broadening of R-R* peak reduces so there is no visual narrowing any more.
Another large effect is that the maximum of broadening is at L/R=0.5 when exchange in R-R* is intermediate and shifts even further away to 0.6 when exchange becomes fast so no initial narrowing is seen any more. Only when exchange rate exceeds 3000/s the maximum of broadening returns to the 0.4 observed in the 2-state model.
These are very significant effects indicative of the U_R model.
k2(B), s-1 |
k2(B)= 0.1 s-1
|
k2(B)= 1 s-1
|
k2(B)= 10 s-1
|
k2(B)= 30 s-1
|
k2(B)= 60 s-1
|
k2(B)= 120 s-1
|
k2(B)= 240 s-1 | k2(B)= 500 s-1 | k2(B)= 1000 s-1 |
Simulate setup_U_RL_fancy_lineshapes U_RL_Af_Bi_fancy_lineshapes1 |
Simulate setup_U_RL_fancy_lineshapes U_RL_Af_Bi_fancy_lineshapes2 |
Simulate setup_U_RL_fancy_lineshapes U_RL_Af_Bi_fancy_lineshapes3 |
Simulate setup_U_RL_fancy_lineshapes U_RL_Af_Bi_fancy_lineshapes4 |
Simulate setup_U_RL_fancy_lineshapes U_RL_Af_Bi_fancy_lineshapes5
|
Simulate setup_U_RL_fancy_lineshapes U_RL_Af_Bi_fancy_lineshapes6 |
Simulate setup_U_RL_fancy_lineshapes U_RL_Af_Bi_fancy_lineshapes7
|
Simulate setup_U_RL_fancy_lineshapes U_RL_Af_Bi_fancy_lineshapes8
|
Simulate setup_U_RL_fancy_lineshapes U_RL_Af_Bi_fancy_lineshapes9 |
|
 |
 |
 |
 |
 |
 |
 |
 |
 |
|
 |
 |
 |
 |
 |
 |
 |
 |
 |
|
 |
 |
 |
 |
 |
 |
 |
 |
 |
|
Plot line width evolution
plotdatasets 'U_RL_fancy_lineshapes6' 'L/R' 'FWHH,/s'

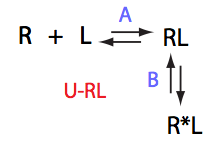
U_RL system gives rise to much more significant line broadening than U system. Visually, when k2(B) brings B-transition into intermediate regime we see narrowing of the average peak at the end of titration (L/R=0.9) followed by a new broadening process. As k2(B) accelerates the effect is reduced and the maximum of broadening in the titration series shifts from L/R 0.4-0.5 to 0.4 (relatively minor shift) and the end-point broadening is reduced as well.
If isomerization is fast then we only see a shifting peak. However, these two cases as still markedly distinct
|
|
|
| Simulate setup U_Af | k2(B)= 240 s-1 Setup setup_U_R_fancy_lineshapes U_R_Af_Bi_fancy_lineshapes7 |
k2(B)= 240 s-1 Simulate setup_U_RL_fancy_lineshapes U_RL_Af_Bi_fancy_lineshapes7 |
|
|
|
|
|
|
|
|
|
Plot line width evolution plotdatasets 'LW_lineshapes7' 'L/R' 'FWHH,/s'
|
||
 |
 |
|
Kd=1e-6 Koff=500 |
[1] Kd: 1.58777e-06 +/- 1.4e-07 |
[1] Kd: 1.30095e-07 +/- 1.4e-08 [2] Koff: 7.68534e+01 +/- 5.2e-01 |
| Kd and Koff are roughly in the range but pattern of discrepancy between U and U_R is remarkable due to significant differences in line broadening distribution across L/R range | Discrepancy between U and U_RL is smaller because line broadening effect is distributed similarly along L/R but much larger line width dictate significantly smaller Koff. Pattern of mismatch between the line shape is less remarkable and very different from what U_R shows. | |
Back to Analysis of Direct and Reverse Titrations
