Back to Analysis of Direct and Reverse Titrations


Intermediate tight/-off rate binding, fast isomerization


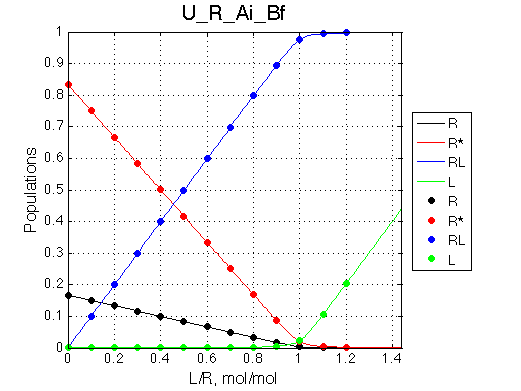
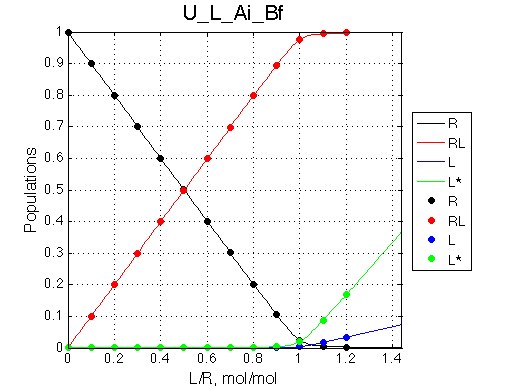
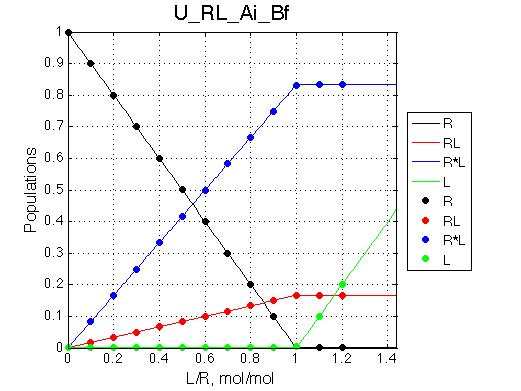
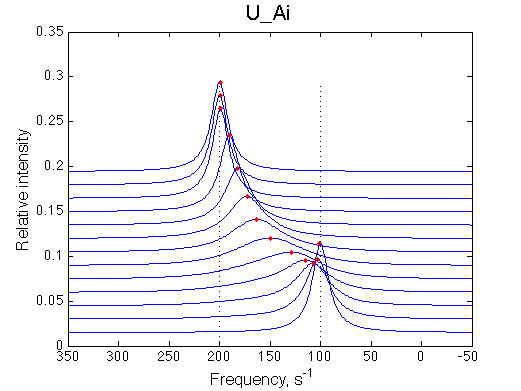
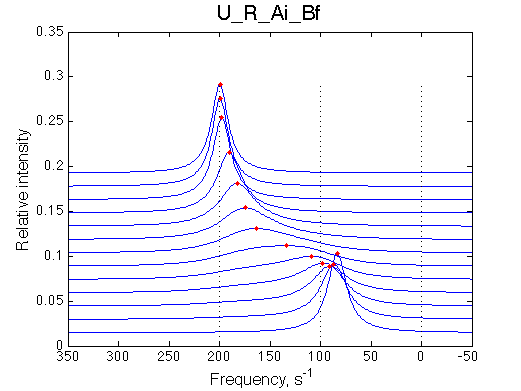
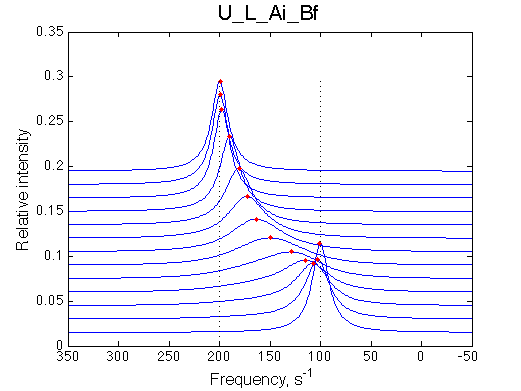
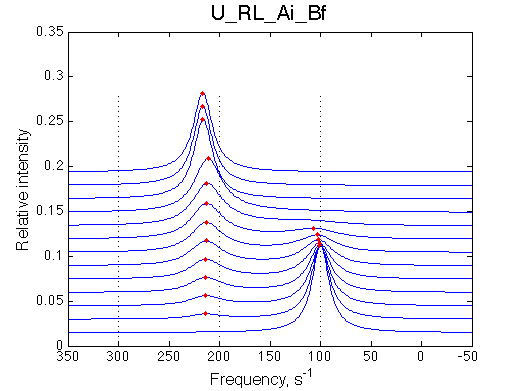
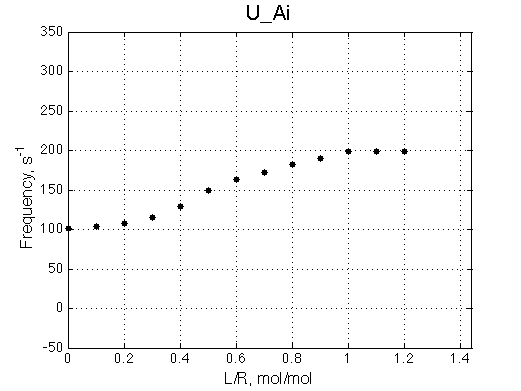
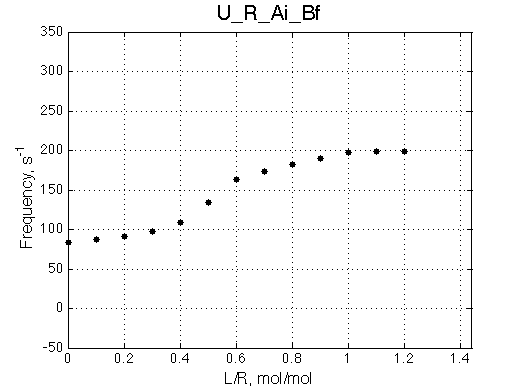
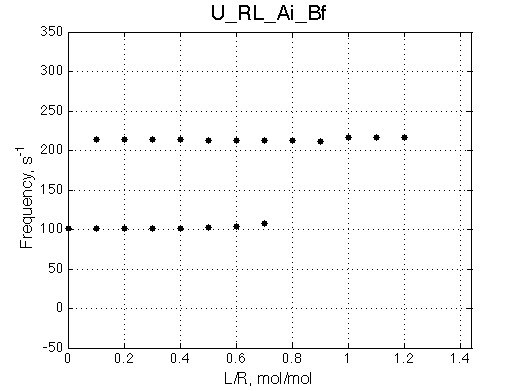
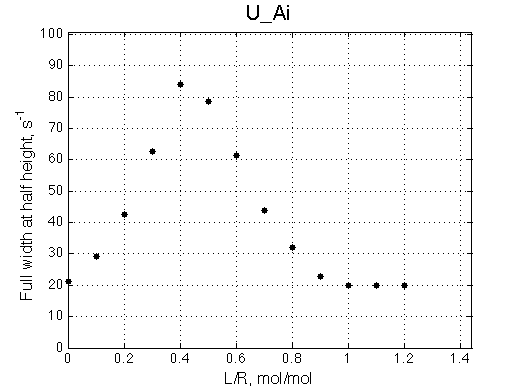
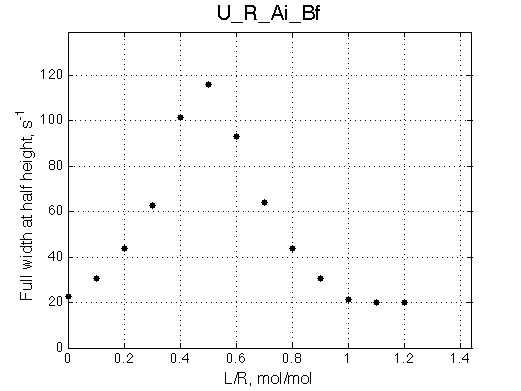
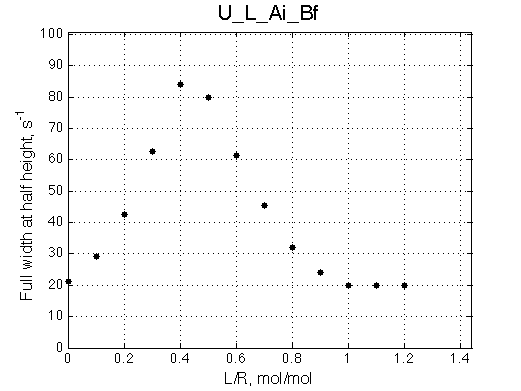
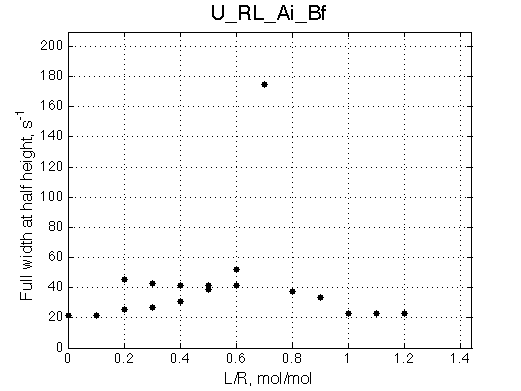
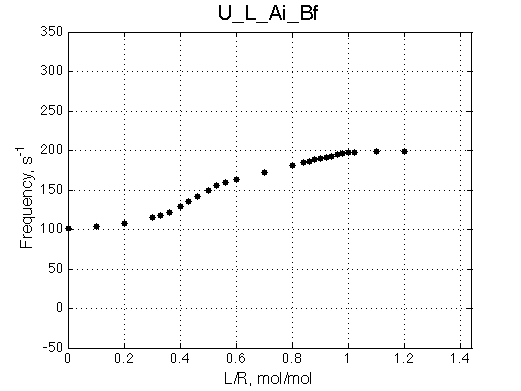
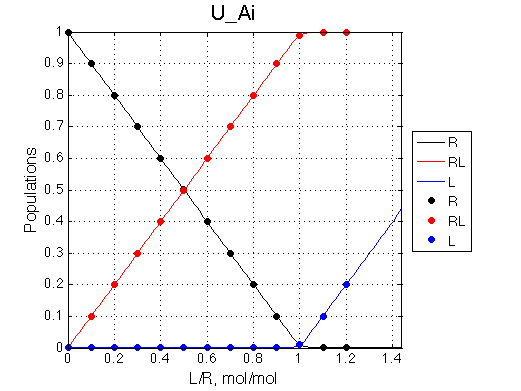
Here we will compare outcomes of the four alternative models for conditions when binding is moderately tight and the off-rate is intermediate. The isomerization is chosen to be fast here. I choose binding affinity of 107 M-1 and off-rate constant of 50 s-1. I choose separation between the major peaks of 100 s-1 to generate most similar spectral appearance. Isomerization equilibrium is shifted 5:1 toward *-forms. The reverse isomerization rate is 170 s-1 to make kex =1000 s-1 .

Location: Ai_Bf/


Simulate setup U_Ai

Simulate setup U_R_Ai_Bf

Simulate setup U_L_Ai_Bf

Simulate setup U_RL_Ai_Bf
Fitting with the 2-site model:
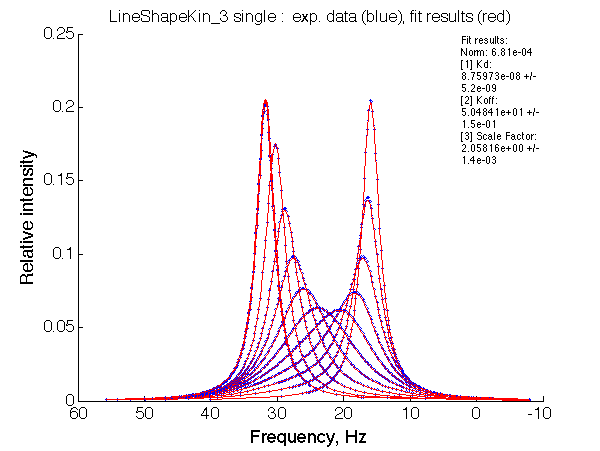
     
Optimum norm: 6.81e-04
[1] Kd: 8.75973e-08 +/- 5.2e-09
[2] Koff: 5.04841e+01 +/- 1.5e-01
[3] Scale Factor: 2.05816e+00 +/- 1.4e-03
Optimum norm: 1.67e-02
[1] Kd: 2.93019e-07 +/- 3.7e-08
[2] Koff: 4.22543e+01 +/- 5.9e-01
[3] Scale Factor: 2.05051e+00 +/- 6.7e-03
Optimum norm: 8.24e-04
[1] Kd: 4.14096e-07 +/- 1.1e-08
[2] Koff: 5.00697e+01 +/- 1.6e-01
[3] Scale Factor: 2.05814e+00 +/- 1.5e-03

Optimum norm: 2.16e-03
[1] Kd: 1.56272e-08 +/- 4.5e-09
[2] Koff: 8.38918e+00 +/- 6.2e-02
[3] Scale Factor: 2.06848e+00 +/- 2.5e-03

The end of titration is systematically off

Simulate 2-site data for these fitted parameters


Simulate setup U_Ai_fit

Simulate setup U_Ai_fit_U_R Simulate setup U_Ai_fit_U_L Simulate setup U_Ai_fit_U_RL

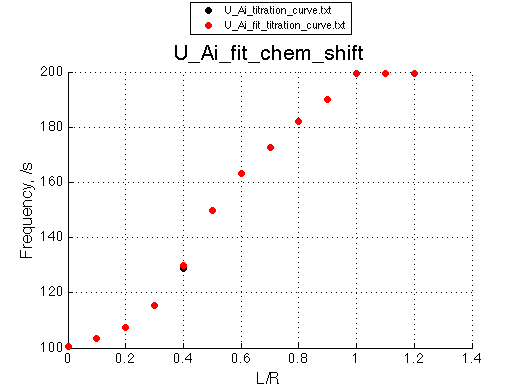
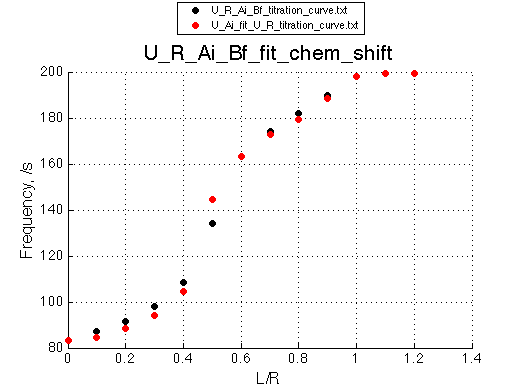
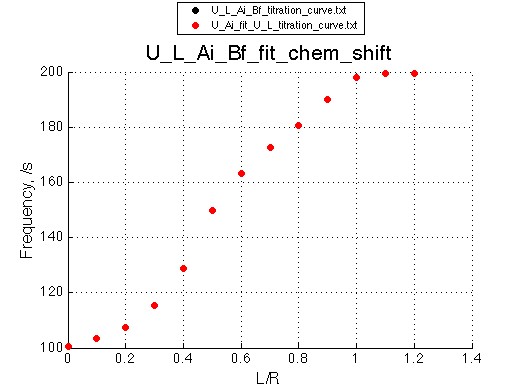
Compare fitted and actual peak positions and line widths

Comparisons/


plotdatasets 'U_Ai_fit_chem_shift' 'L/R' 'Frequency, /s'
plotdatasets 'U_R_Ai_Bf_fit_chem_shift' 'L/R' 'Frequency, /s'
plotdatasets 'U_L_Ai_Bf_fit_chem_shift' 'L/R' 'Frequency, /s'
plotdatasets 'U_RL_Ai_Bf_fit_chem_shift' 'L/R' 'Frequency, /s'
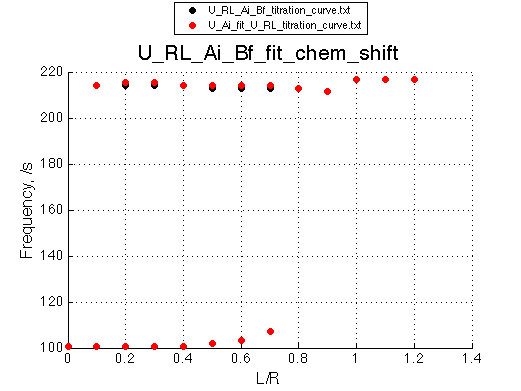
plotdatasets 'U_Ai_fit_LW' 'L/R' 'Frequency, /s'
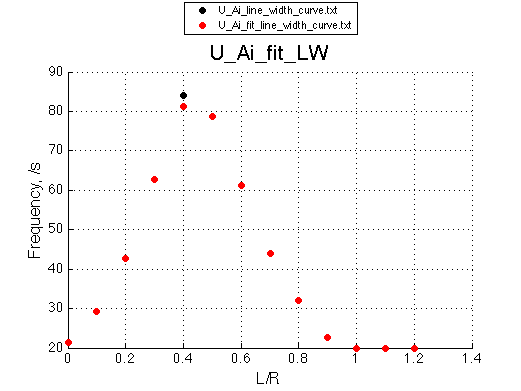
plotdatasets 'U_R_Ai_Bf_fit_LW' 'L/R' 'Frequency, /s'
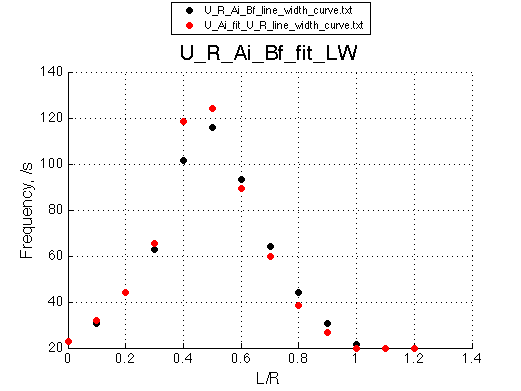
plotdatasets 'U_L_Ai_Bf_fit_LW' 'L/R' 'Frequency, /s'
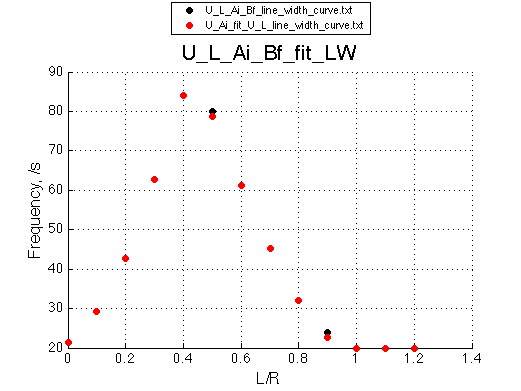
plotdatasets 'U_RL_Ai_Bf_fit_LW' 'L/R' 'Frequency, /s'
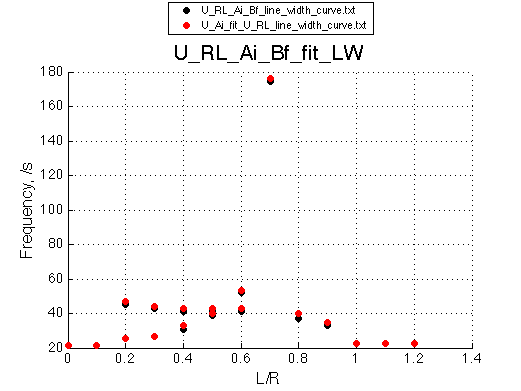


Recalculation with the better sampling of the transition region L/R=0.85-1.05. Let' redo the calculation with a new setup file:


Simulate setup2 U_Ai

Simulate setup2 U_R_Ai_Bf

Simulate setup2 U_L_Ai_Bf

Simulate setup2 U_RL_Ai_Bf

The two-site exchange model will look the same in direct and reverse titration Forward titration and reverse titrations look the same. However, the line peak shifts and line shapes are different. Need to fit with the 2-site model to see the effect  

Additional points are very helpful in seeing the features but less practical.


Conclusions

Combination of forward and reverse titration fitted with 2-site model is capable of identifying U_R/U_L mechanism.


Back to Analysis of Direct and Reverse Titrations