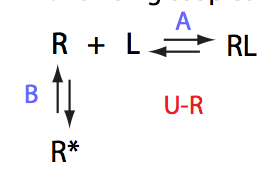
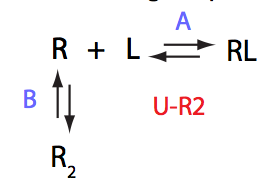
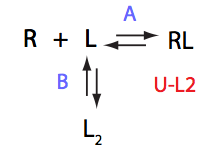
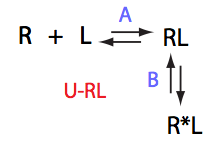
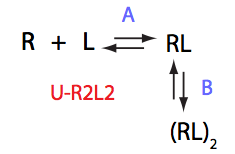
Model
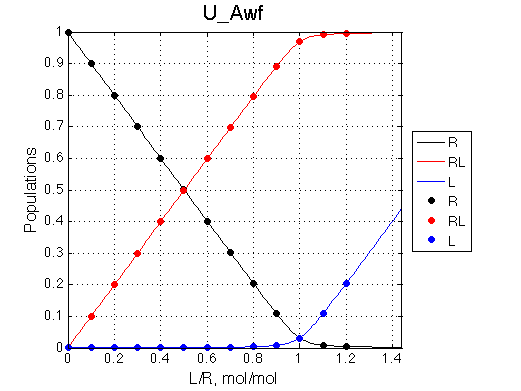
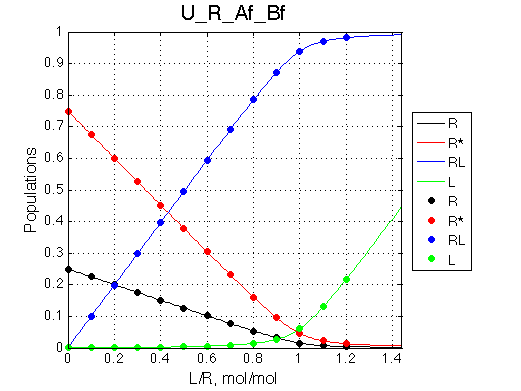
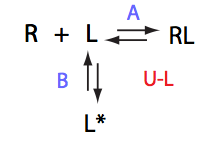
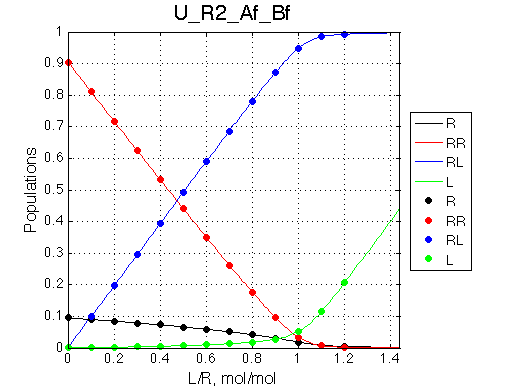
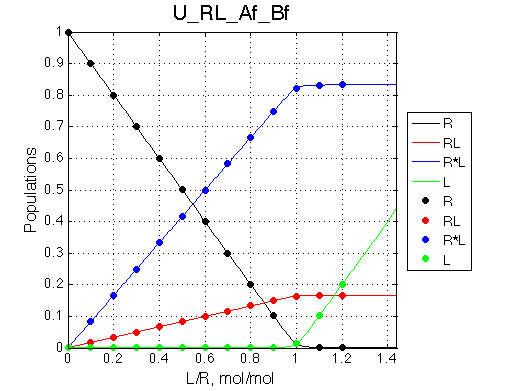
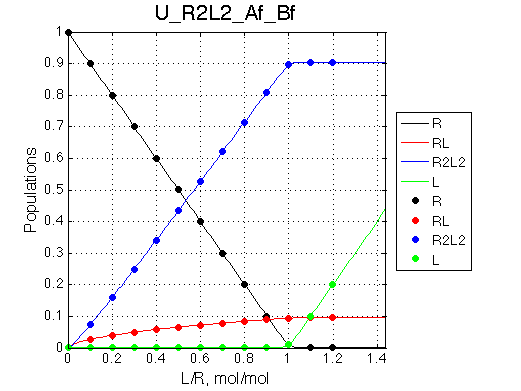
Populations graph
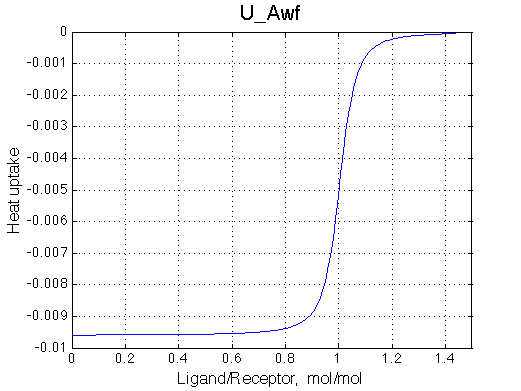
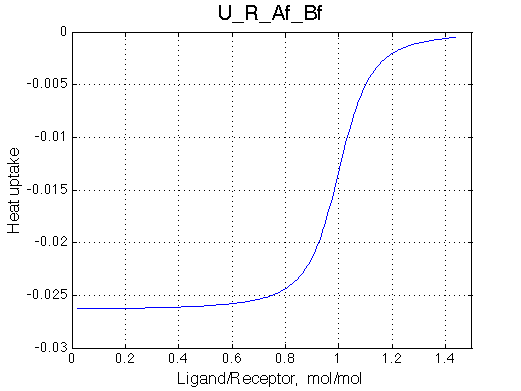
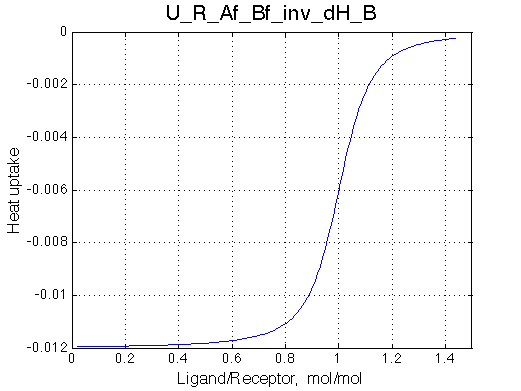
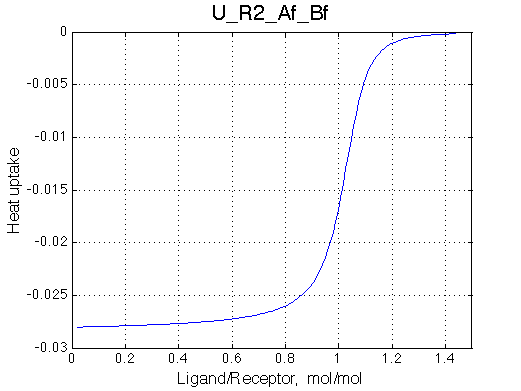
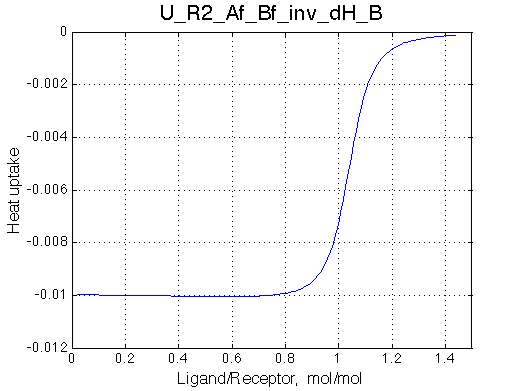
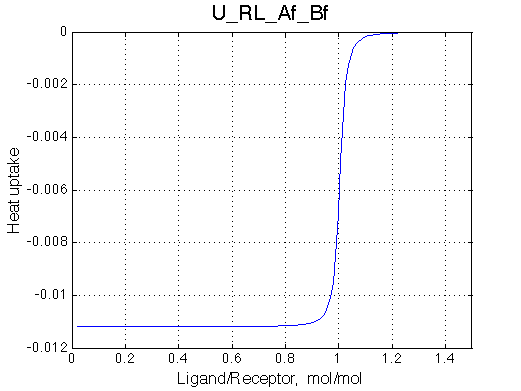
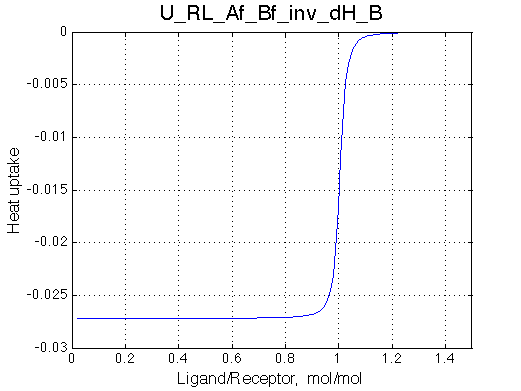
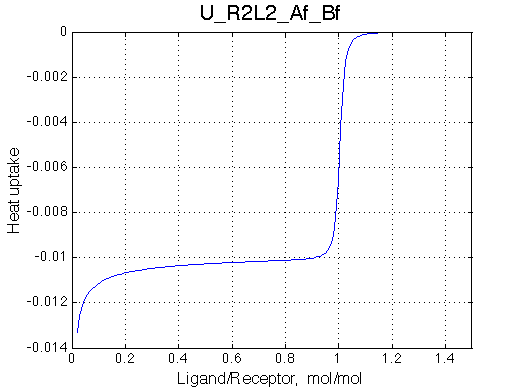
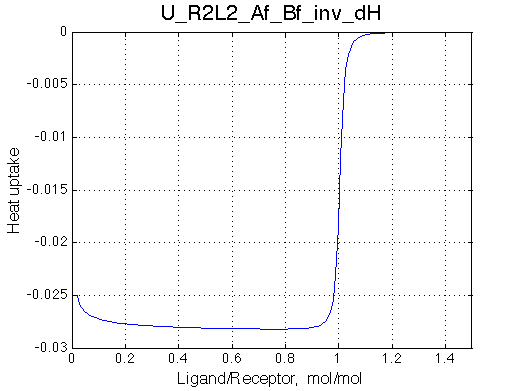
ITC profile
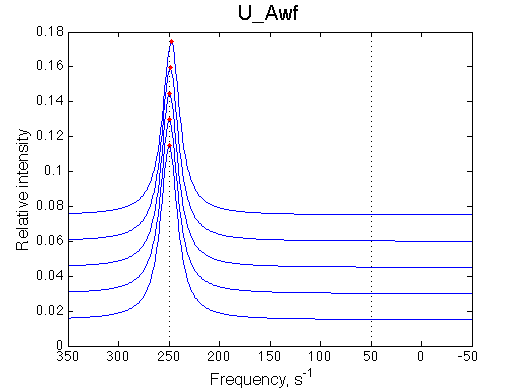
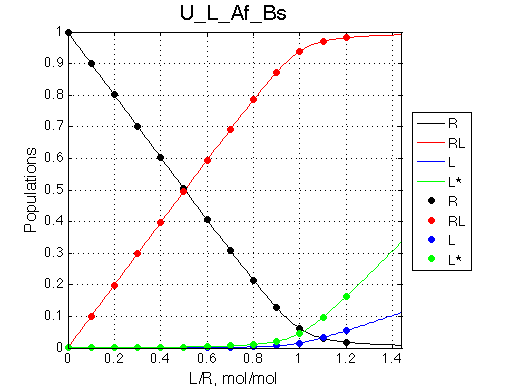
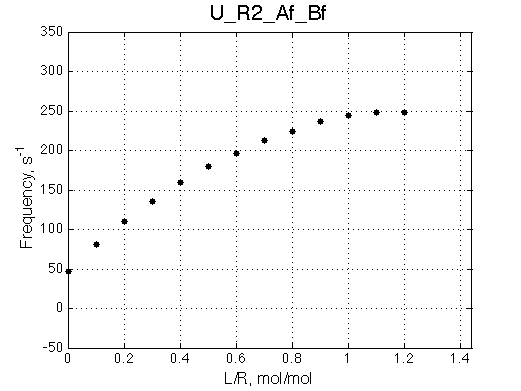
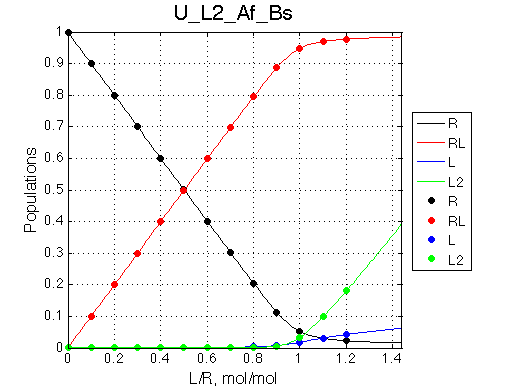
Dependence of the position of the unbound receptor peak upon 20x dilution
Dependence of the position of the final saturated (L/R=2.5) receptor peak upon 20x dilution
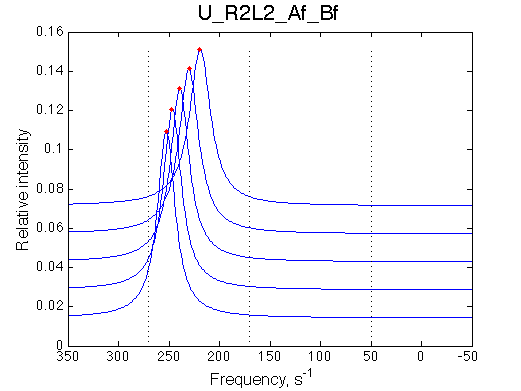
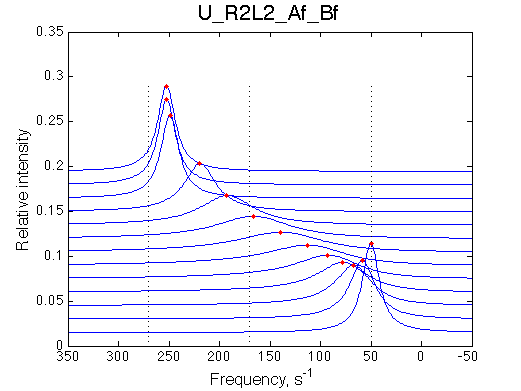
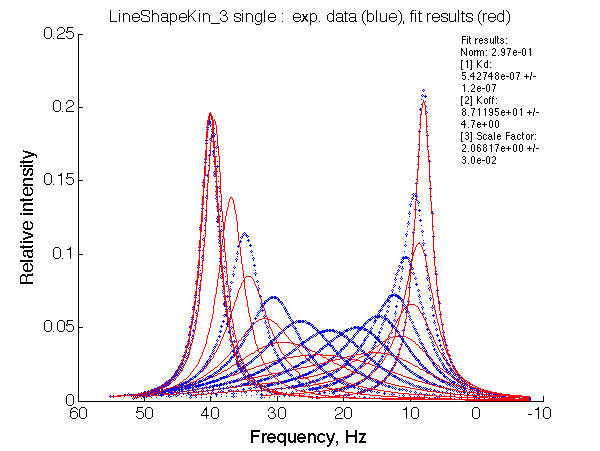
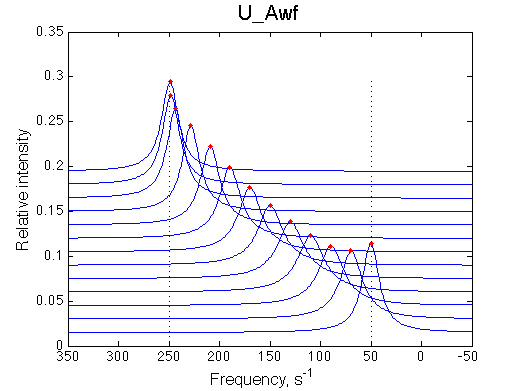
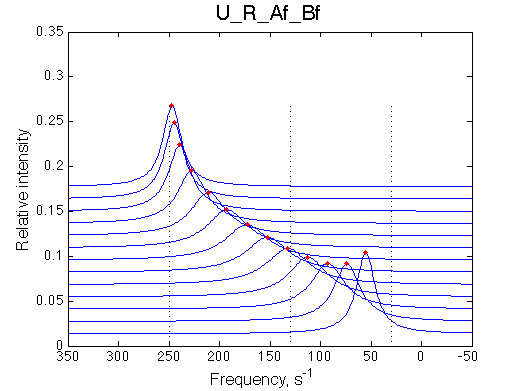
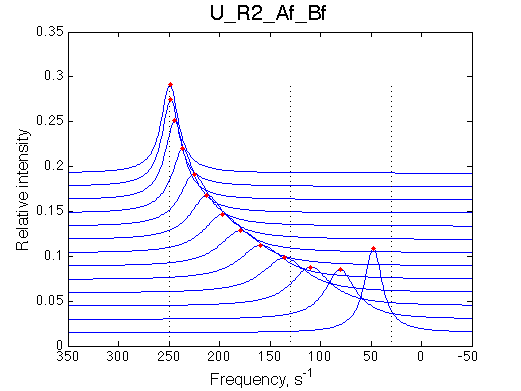
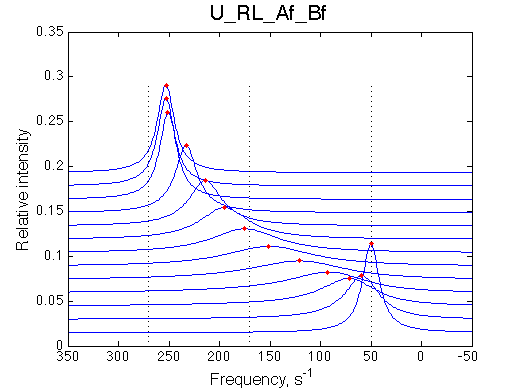
Forward titration
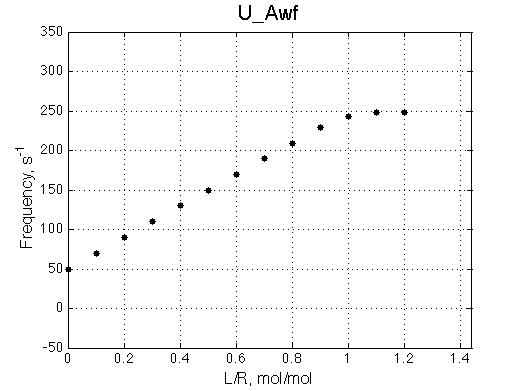
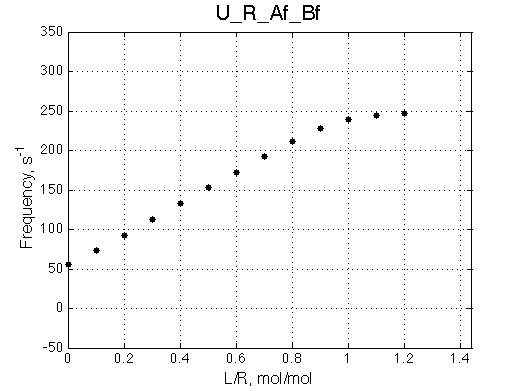
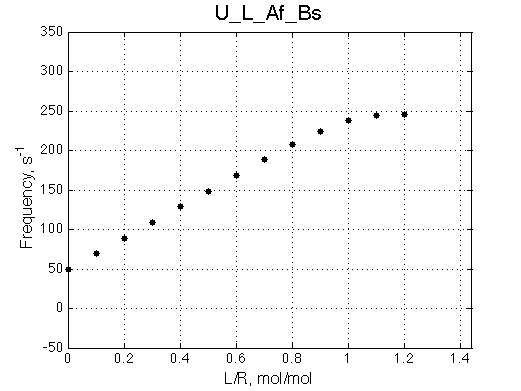
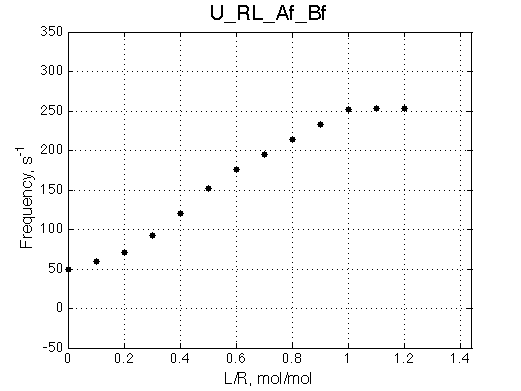
Chemical shift change upon titration
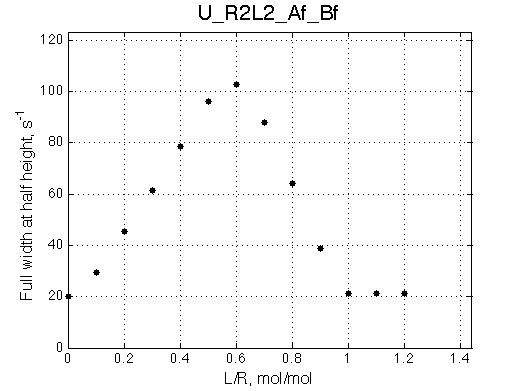
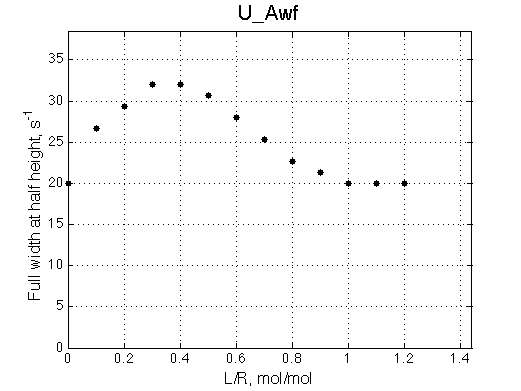
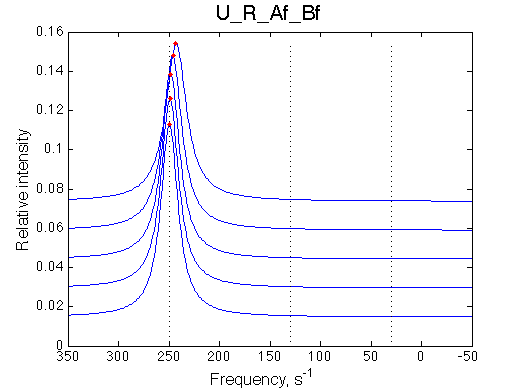
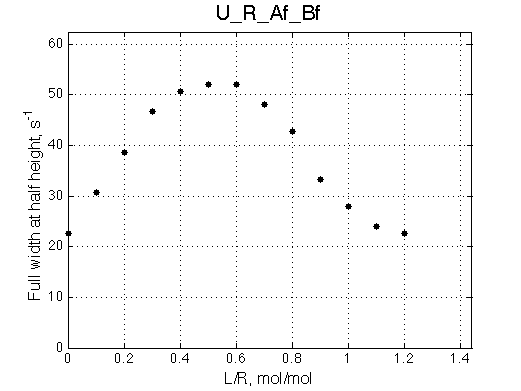
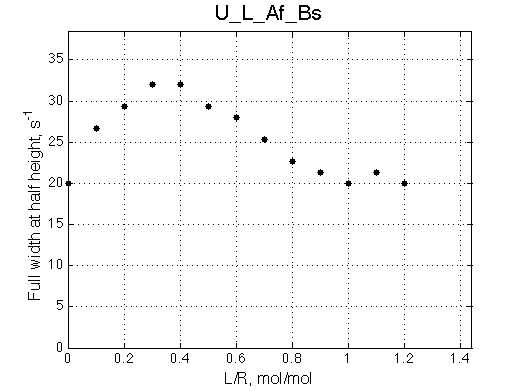
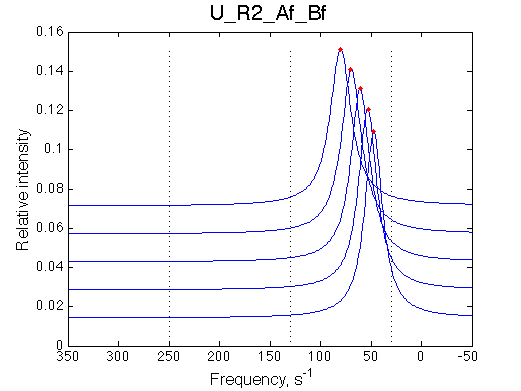
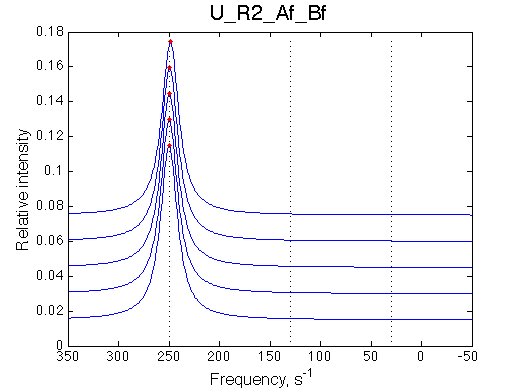
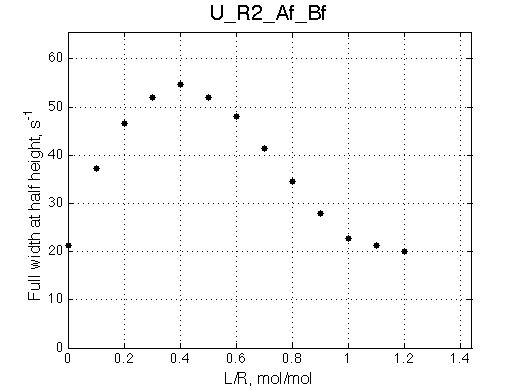
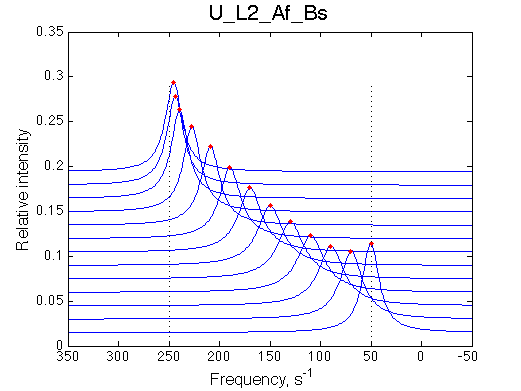
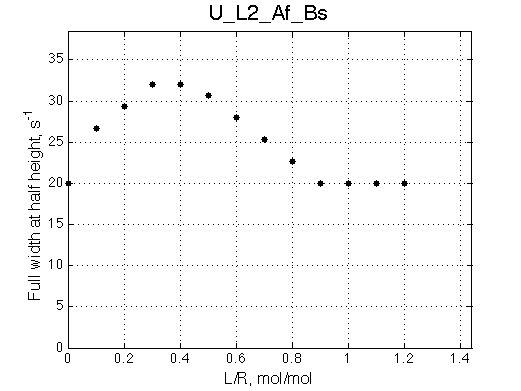
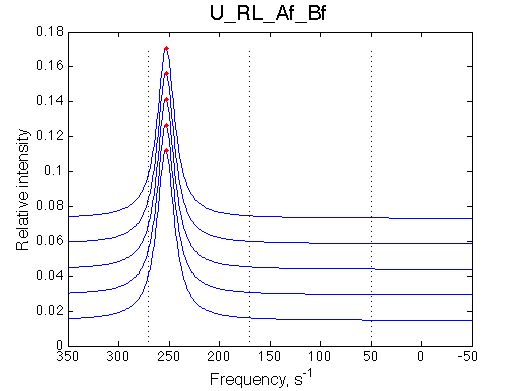
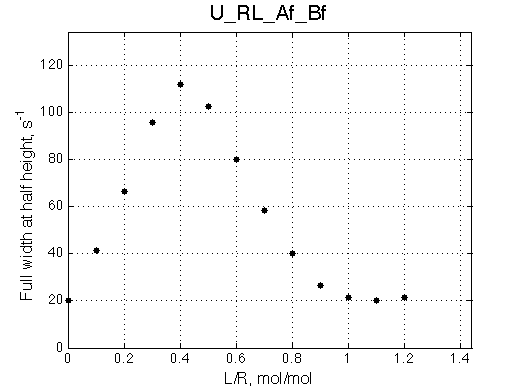
Line broadening
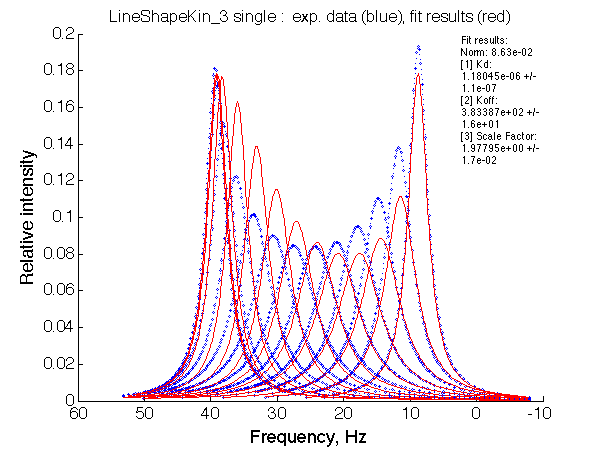
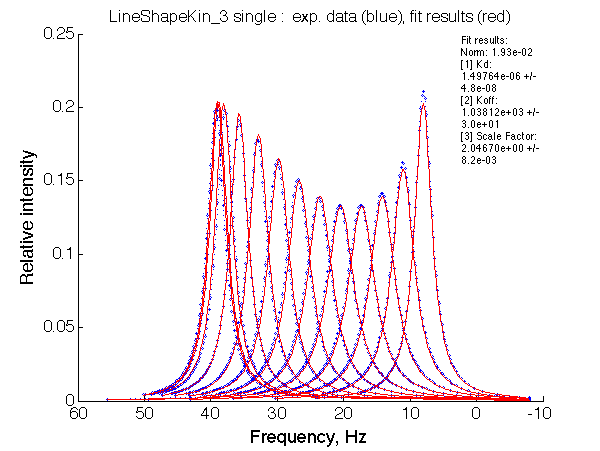
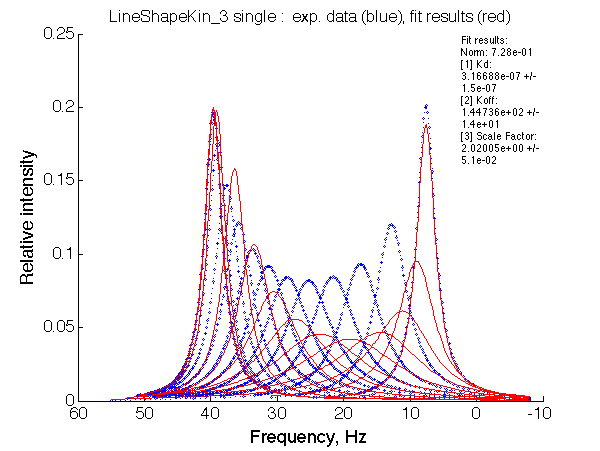
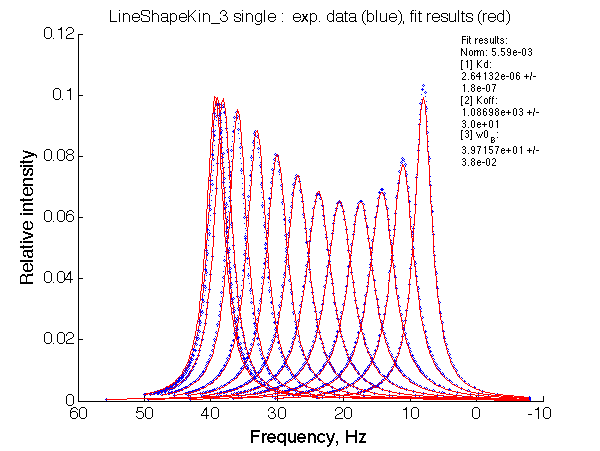
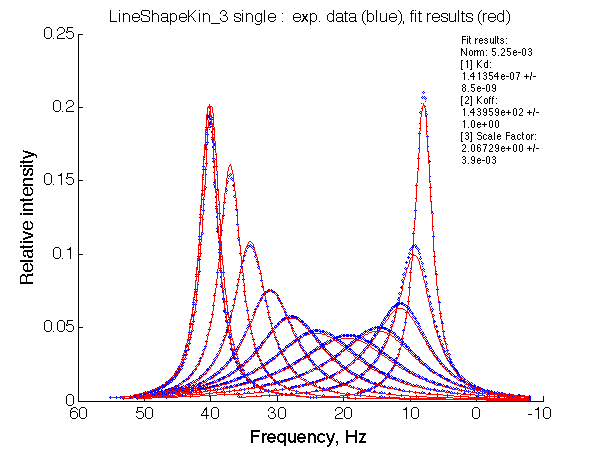
Fit with U model

none
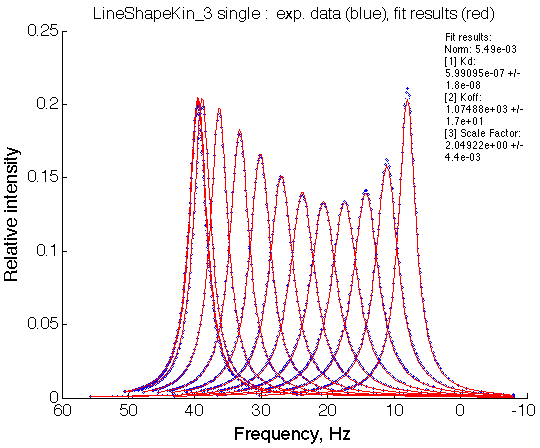
- Fitted Ka =1/Kd = 1.7e+06 M-1 is in a good agreement with the pre-set Ka=1e6.
- Fitted Koff =1080 s-1 agrees well with the preset k2=1000 s-1.
 |
 |
none
none

Ka=1/Kd= 0.67e+06 versus Ka=1e6 used in the simulation. Ka is supposed to be scaled down by the competing formation of L*.
Koff is accurate: 1040+-30/s vs. 1000/s used in the simulation.
 |
 |
none

Ka=1/Kd = 0.37e6 vs. 1e6 used for simulation
Koff=1090 /s - close to 1000/s used.
 |
 |
none
The fit is relatively good, with a slight mismatch due to line width differences.
Remarkable that Ka=1/Kd= 7e+06, which is 7x larger than 1e6 used in the simulation.
In opposite, Koff=150/s, much slower than the k2(A)=1000/s and k2(B)=1000/s used in the simulation.
 |
 |
none