

In this model the receptor binds ligand and forms a dimerization-competent complex. By definition, the ligand cannot dissociate from the complex in a dimer, only when dimer dissociates.
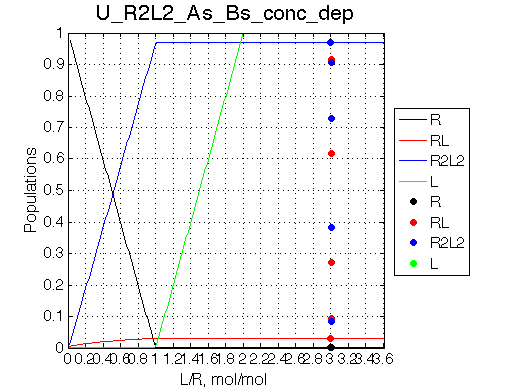
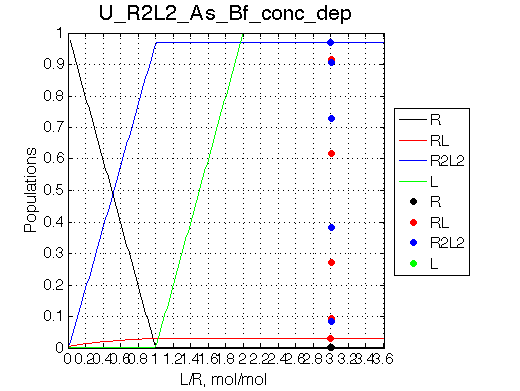
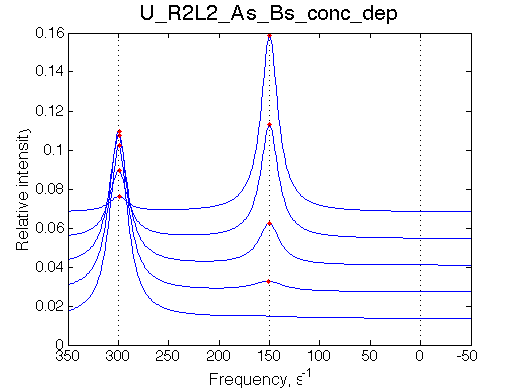
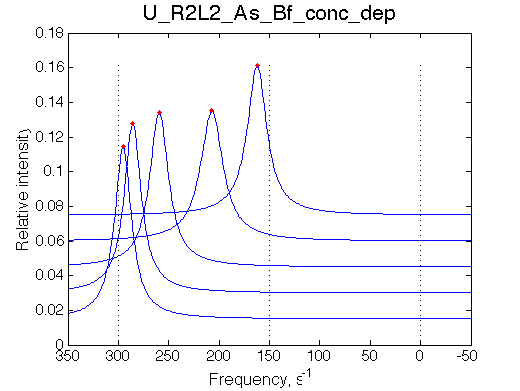
Here I will have make saturated complex and change concentrations to see redistribution of the species. LRratio will have tiny increment to separate points on L/R axis.
Slow dissociation |
Fast dissociation |
Simulate setup_conc_dep U_R2L2_As_Bs_conc_dep NOTE: All graphs scale L/R from 0 so I have to resave FIG and PNG files to have L/R=[3.000 - 3.006]. |
Simulate setup_conc_dep U_R2L2_As_Bf_conc_dep |
 |
 |
 |
 |
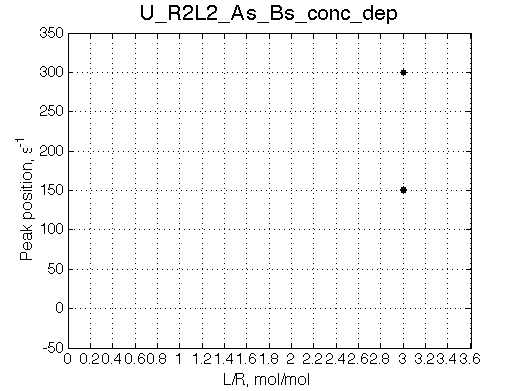 |
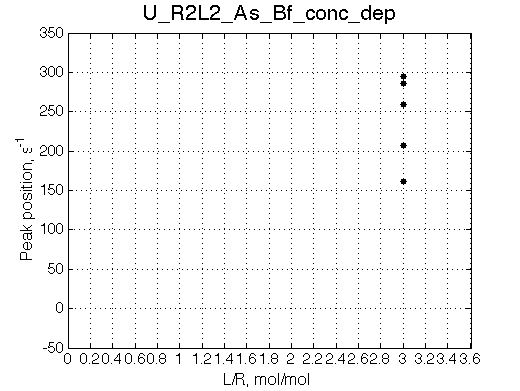 |
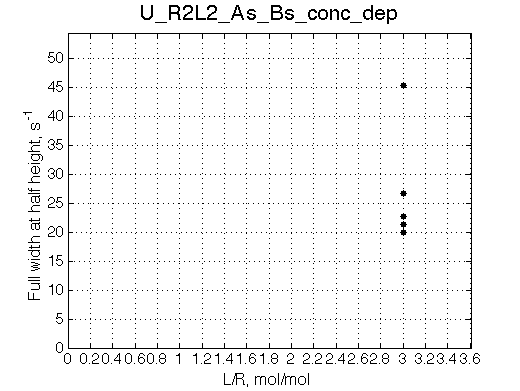 |
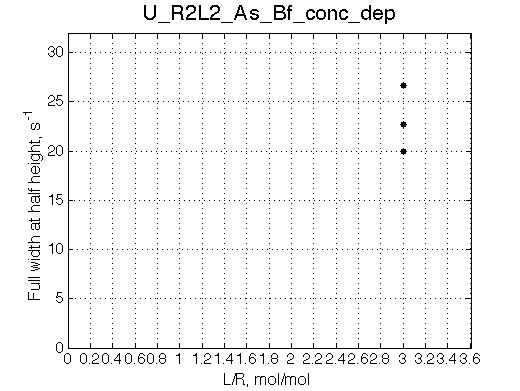 |
Conclusion:
The model adequately predicts distribution of species and their line shapes upon successive dilutions.
Simulate setup U_R2L2_As_Bs
Report: summary_report
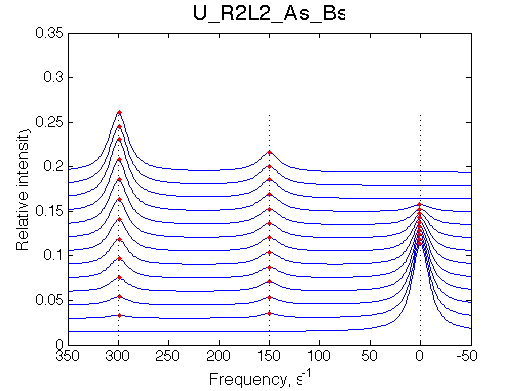
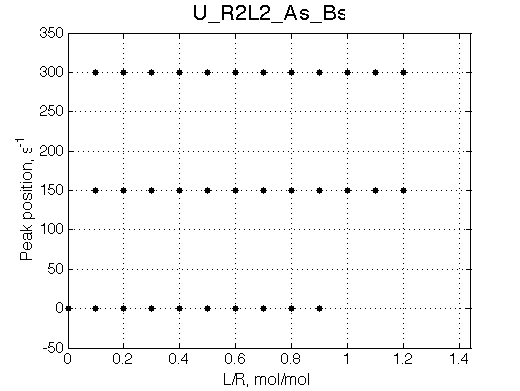
Slow exchange, three peaks with new peaks growing non-proportionally to each other.
Simulate setup U_R2L2_Af_Bs
Report: summary_report
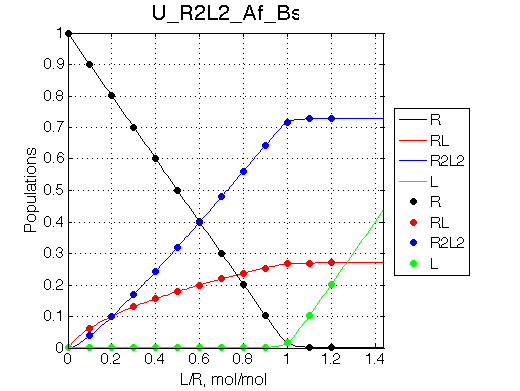
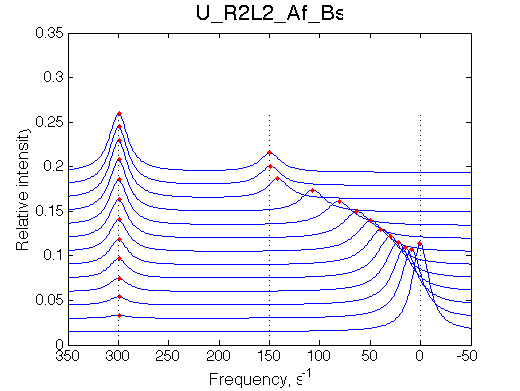
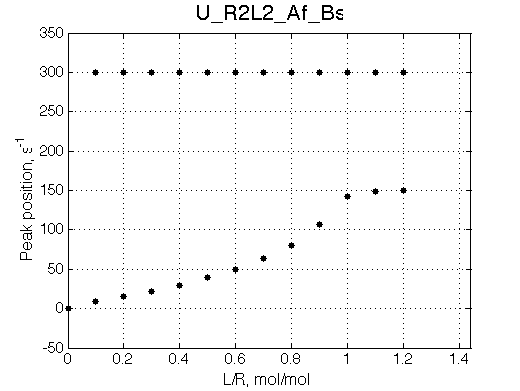
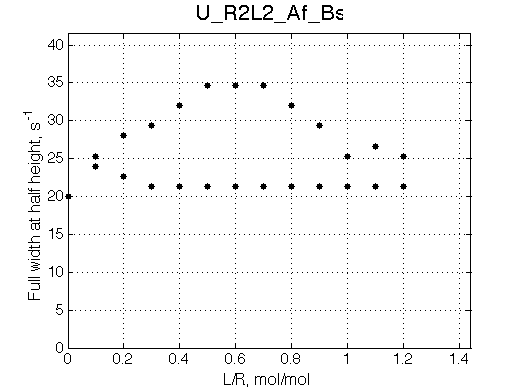
This spectral appearance is very similar to U_RL in the similar exchange regime and to U_R2 with fast dissociation and slow binding
If the fast-exchange peak is taken to fit 2-site exchange it would NOT fit for the reason of non-linearity of the chemical shift change and that the maximum broadening is achieved at 0.6 rather than 0.4 for 2-site line shapes.
Let's try:
(truncate the spectral width in a new simulation to only leave the fast-exchange peak)
Simulate setup_truncated_range1 U_R2L2_Af_Bs


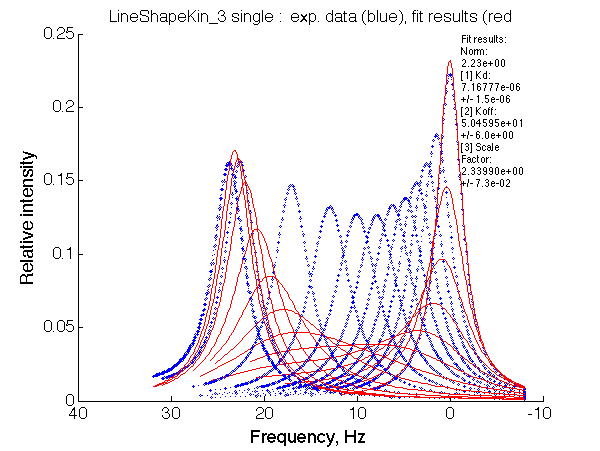
Fit is EXTREMELY POOR, indicative one has to look for a more complex model.
Simulate setup U_R2L2_Af_Bf
Report: summary_report
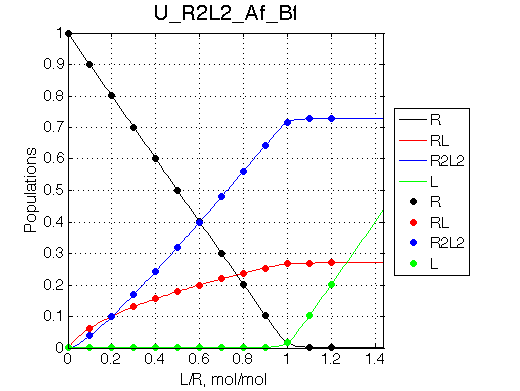
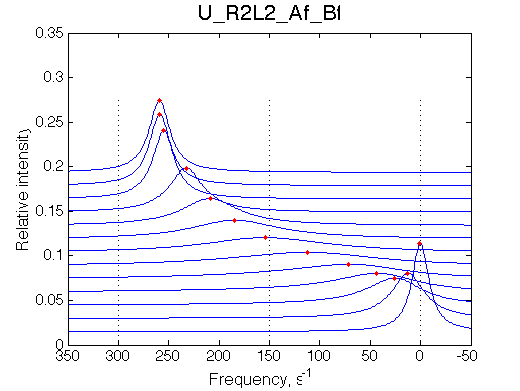
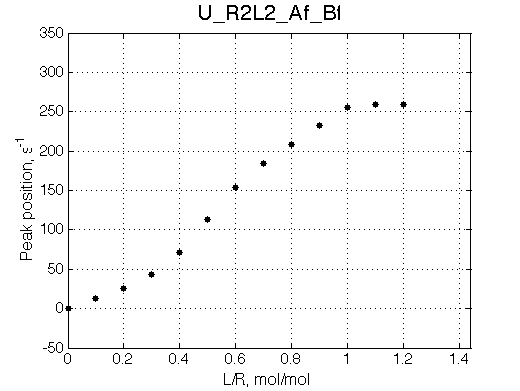
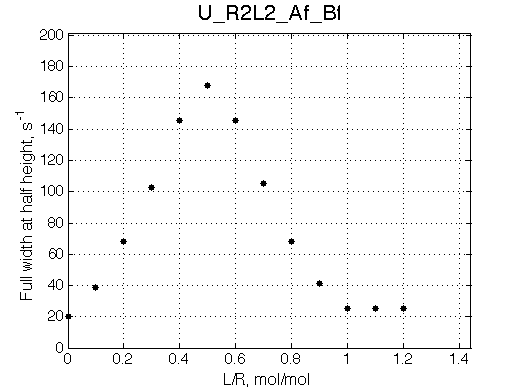
We may predict that fitting will fail with 2-site model unable to reproduce line width pattern:

Optimum norm: 2.17e-01
[1] Kd: 1.09457e-06 +/- 1.8e-07
[2] Koff: 1.17928e+02 +/- 5.5e+00
[3] Scale Factor: 2.17523e+00 +/- 2.8e-02
Fit is poor, indicative that the model is more complex than U.
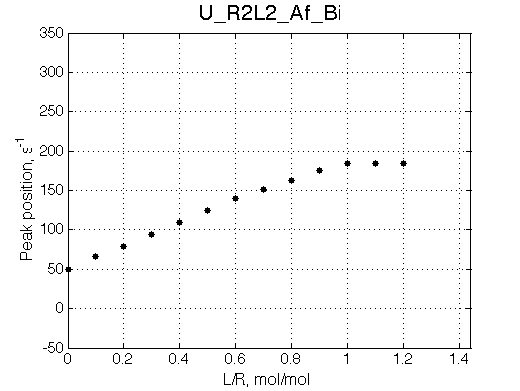
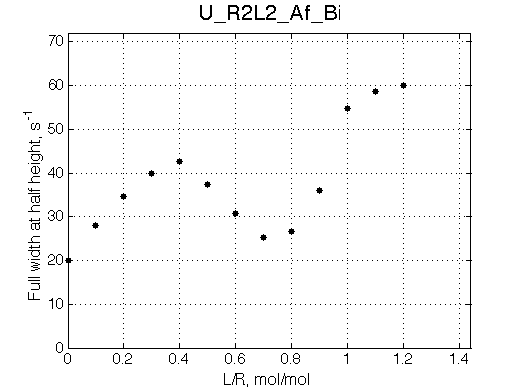
Here we place R2L2 chemical shift in between R an RL so the fast exchange peak crosses its position. When dissociation is in fast-intermedate exchange the peculiar 'transient narrowing' of the averaged peak at L/R=0.9 is observed.
Simulate setup U_R2L2_Af_Bi
Report: summary_report
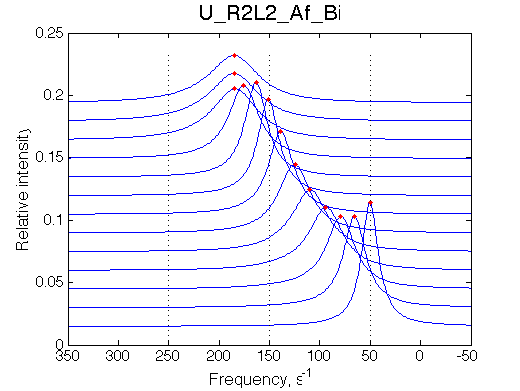
Simulate setup U_R2L2_As_Bf
Report: summary_report
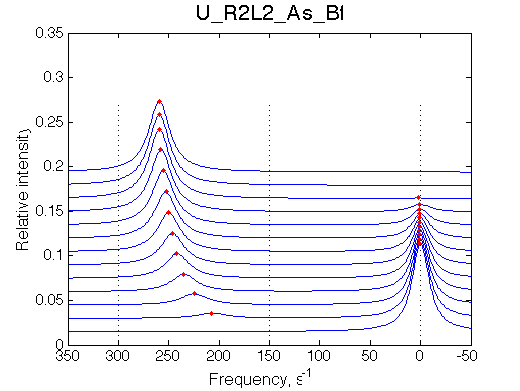
This spectrum is similar to U_R and U_R2 in slow isomerization/dissociation and fast binding.
Looking at the different cases we may notice that we have a limited pattern of spectral appearances that can be accounted for by different models. In another chapter I will investigate how to tell apart the models doing additional data analysis.
Back to LineShapeKin Simulation Tutorial